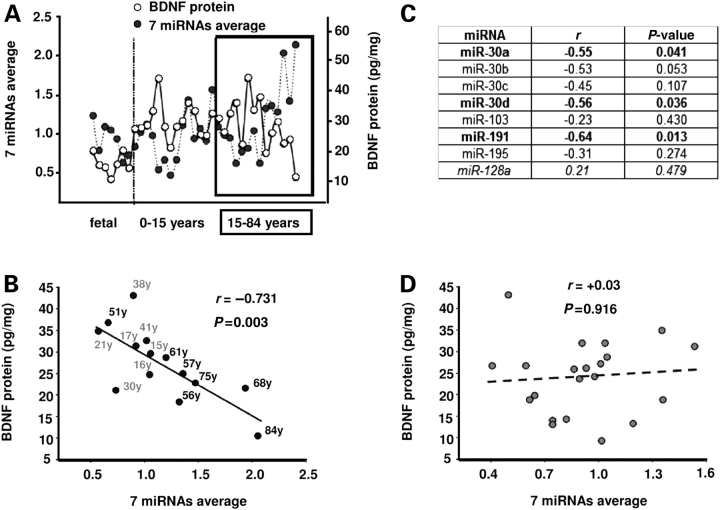
Figure 6.
Inverse correlation between BDNF protein and BDNF-related miRNAs in late adolescent and adult PFC. (A) Plot showing case-by-case the relative changes in BDNF protein (white circles) when compared with weighted average of all seven miRNA probes (black) across the life span (n = 35). Notice the consistent inverse relationship between BDNF and miRNA average from late adolescence until old age (15–84 years, box in graph). (B) Inverse correlation between BDNF protein and average from weighted means of the seven miRNAs for 15–84-year-old samples (y, year, 15–41 shown in gray, rest shown in black); r, Pearson coefficient. Notice, also, declining BDNF, and increased miRNA levels in six out of the seven oldest samples. (C) Table showing correlations between miRNAs and BDNF protein in late adolescent and adult (15–84 years old) PFC. Notice independent significant inverse correlations between miR-30a, miR-30d and miR-191 with BDNF protein (all shown in bold), and lack of inverse relationship between BDNF and a control miRNA (miR-128a, shown in italics) not predicted to target BDNF. (D) No correlation between BDNF protein and average from weighted means of the seven miRNA probes for fetal to 15-year-old samples.

