
Figure 6.
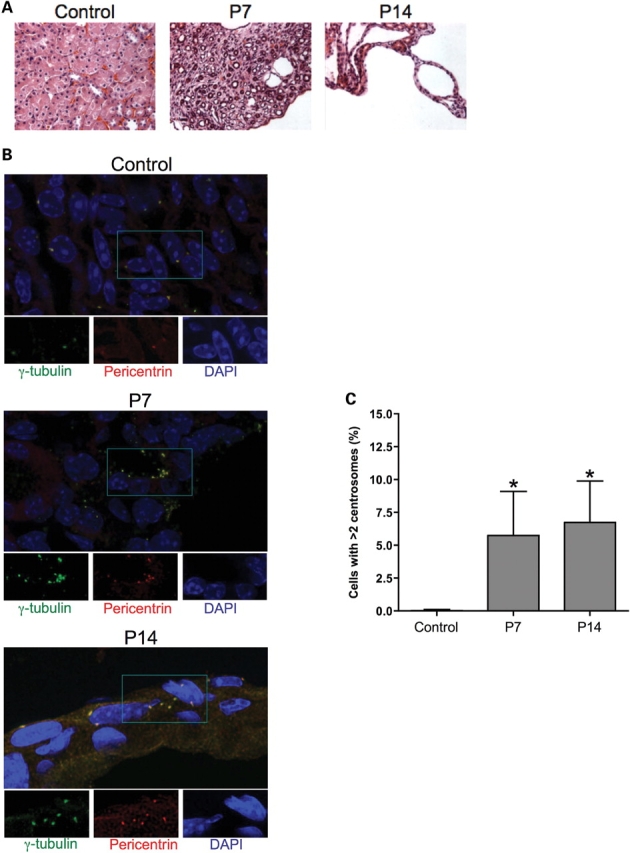
Centrosomal amplification in Pkd1 knockout mouse model. (A) Sections from control (P15) and Pkd1flox/-:Ksp-Cre (P7 and P14) kidneys were stained with hematoxylin and eosin (H&E) to define the cystic progression (original magnification ×400). (B) Centrosomes were identified using pericentrin (red) and γ-tubulin (green) immunostaining and DAPI-counterstaining. Large frames show the merged images. Individual stainings of areas in the insets are shown below (original magnification ×1000). (C) The number of cells with supernumerary centrosomes (>2) was determined by counting six randomly chosen fields across two slides (n > 350). Statistical analysis was performed using ANOVA with Bonferroni post-test; *P = 0.0011 compared to control. No statistical difference was observed between P7 and P14.