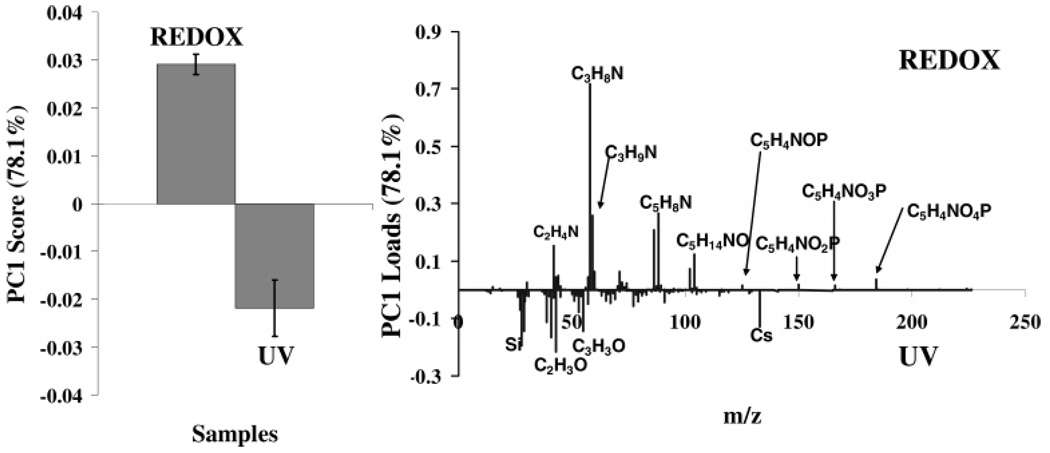
Figure 2.
PCA scores (left) and loadings (right) plot comparing positive ion ToF-SIMS data from UV- and redox-polymerized bilayers. While the same peaks are found on both types of surfaces, peaks associated with the lipid head group (C3H8N+, C5H4NO4P+, etc.) loaded more strongly with the redox-polymerized PSLBs. Peaks associated with the lipid tails (C3H8O+, etc.) and silicon (Si+, SiOH+, etc.) loaded more strongly with the UV-polymerized PSLBs.

