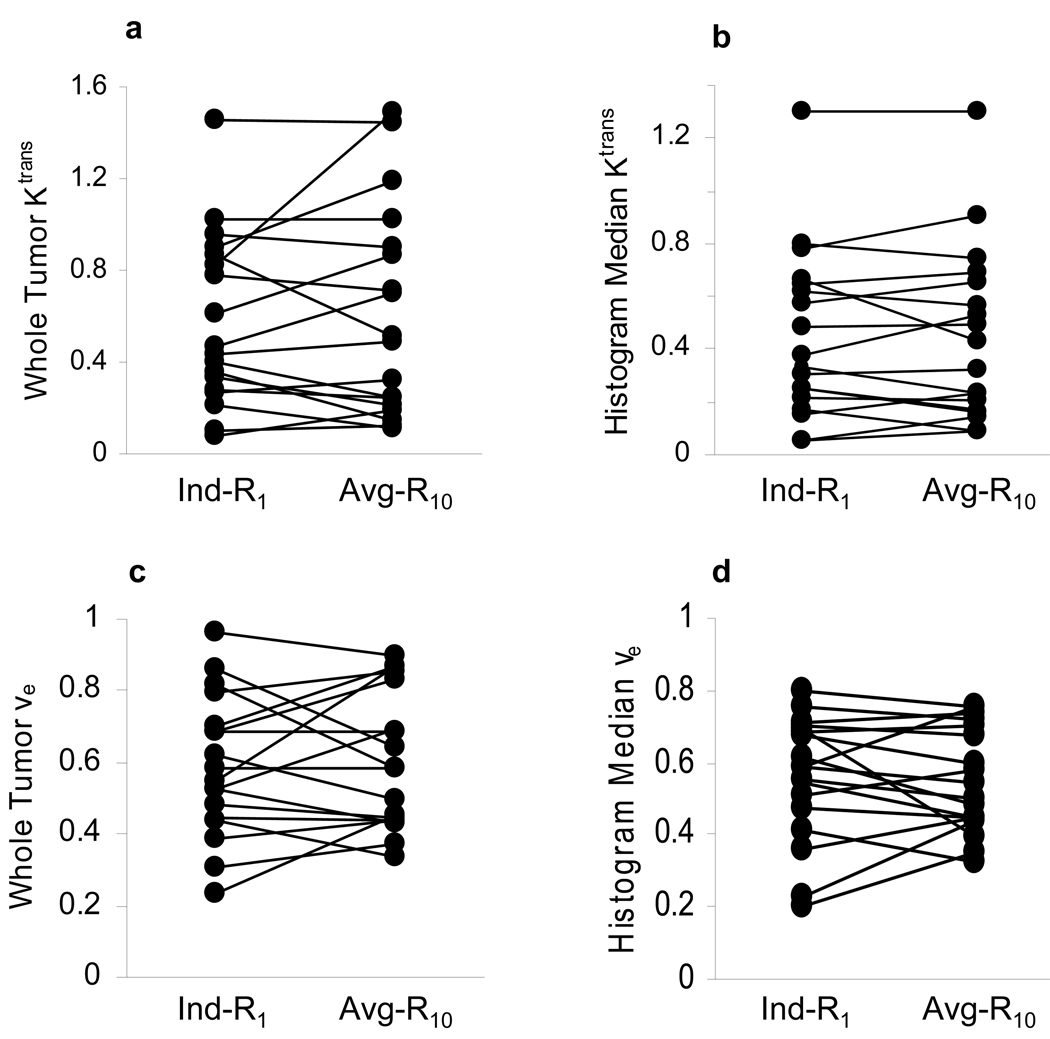
Figure 2.
Scatter plots of Ktrans (min−1) and ve parameters obtained from pharmacokinetic modeling analyses of DCE-MRI data from eighteen patients with lower extremity osteosarcomas. Kinetic analyses with the individual R1 measurement (Ind-R1) approach and the average R10 (Avg-R10) approach were performed for each study, yielding whole tumor ROI Ktrans (a) and ve (c), and median values from histogram analyses of pixel Ktrans (b) and ve (d) parameters within the tumor. The straight lines connect data points from the same patient.

