
Figure 3.

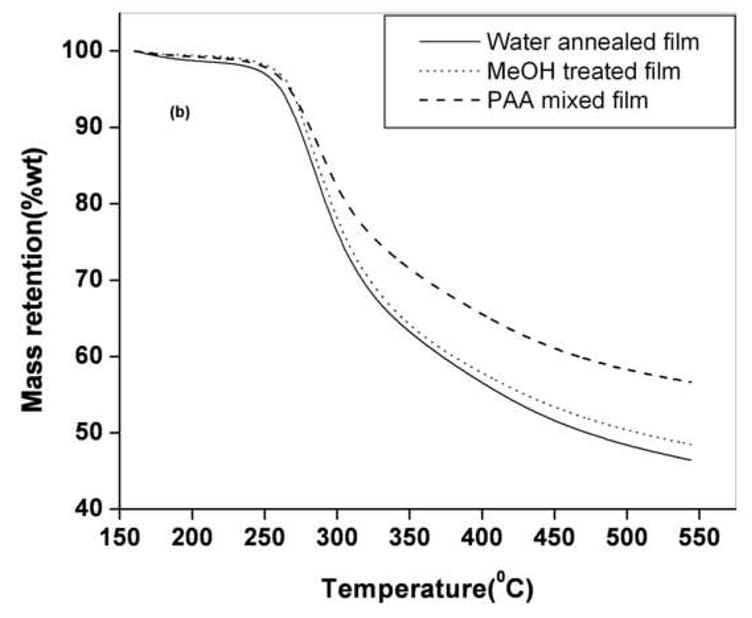
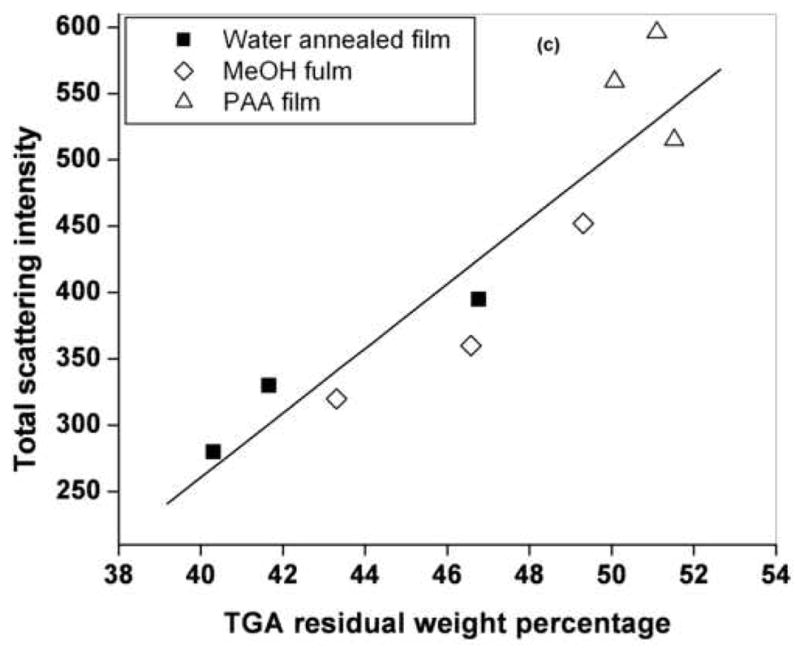
Figure 3a. Specific reversing heat capacity Cp of MeOH treated (dot line), water annealed (dash line) and PAA mixed (solid line) films during TMDSC scanning at the heating rate of 4 °C/min. Inset shows the method of ΔCp calculation for MeOH treated
Figure 3b. TGA thermograms of water annealed (solid line), MeOH treated (dots) and PAA mixed film (dash) after seventh cycle of mineralization. PAA mixed films demonstrate highest residual weights at higher temperatures
Figure 3c. Correlation (correlation coefficient of 0.8924) of light scattering intensity and TGA residual weights for water annealed, MeOH treated and PAA mixed silk films.