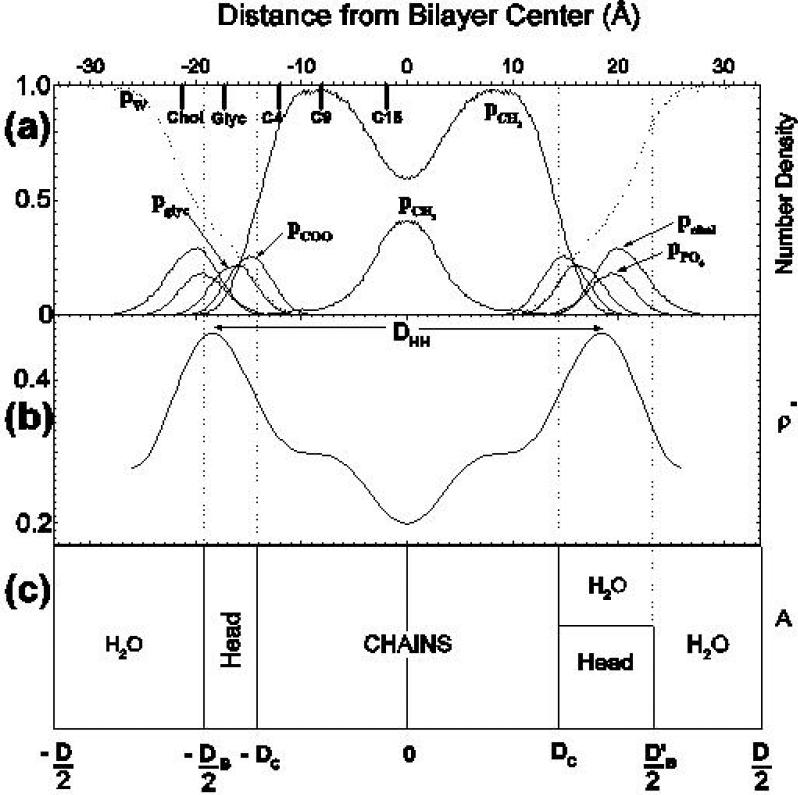
Fig. 2.
Several views of the structure of fully hydrated DPPC in the Lα phase (T = 50°C). (a) the curves show simulated probability distribution functions [9] for various component groups and the solid bars at the top left of the figure show average positions from neutron diffraction [3]. (b) shows an electron density profile [5]. (c) shows two volumetric views, employing Gibbs dividing surfaces, that relate lateral area A to various thicknesses. Both volumetric views in (c) show the hydrocarbon thickness 2DC. The view on the left shows the Luzzati bilayer thickness DB and the more realistic view on the right mixes water into the headgroup region to show the steric thickness . The Luzzati thickness is given by DB = VL/A, where for DPPC the lipid volume is accurately determined to be VL = 1232±2Å3 per molecule [5].

