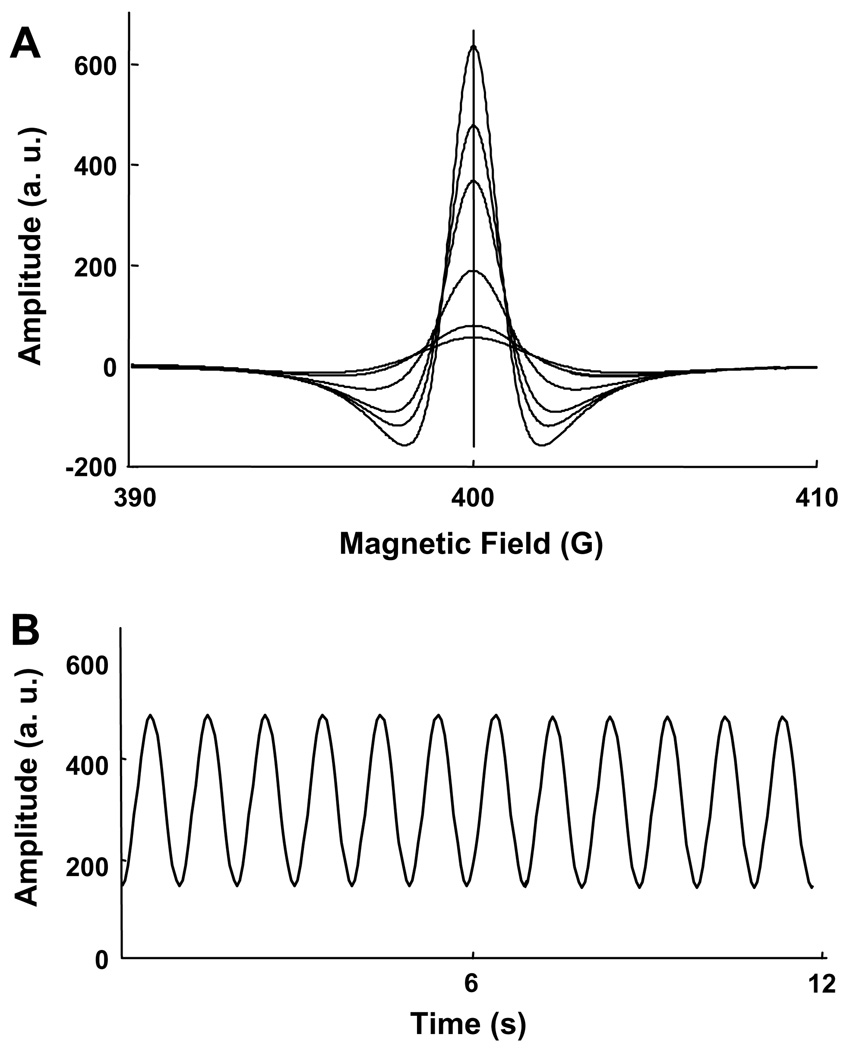
Fig. 3.
Simulation EPR lineshape as a function of periodic changes in linewidth of a Lorentzian function. (A) Second derivative spectra corresponding to changes in linewidth. The vertical line corresponds to the resonance field. (B) Temporal changes in spectral amplitude at the resonance field as a function of periodic linewidth modulation. As shown, the response to pressure modulations at 1 Hz is measured in EPR as amplitude changes at 1 Hz.

