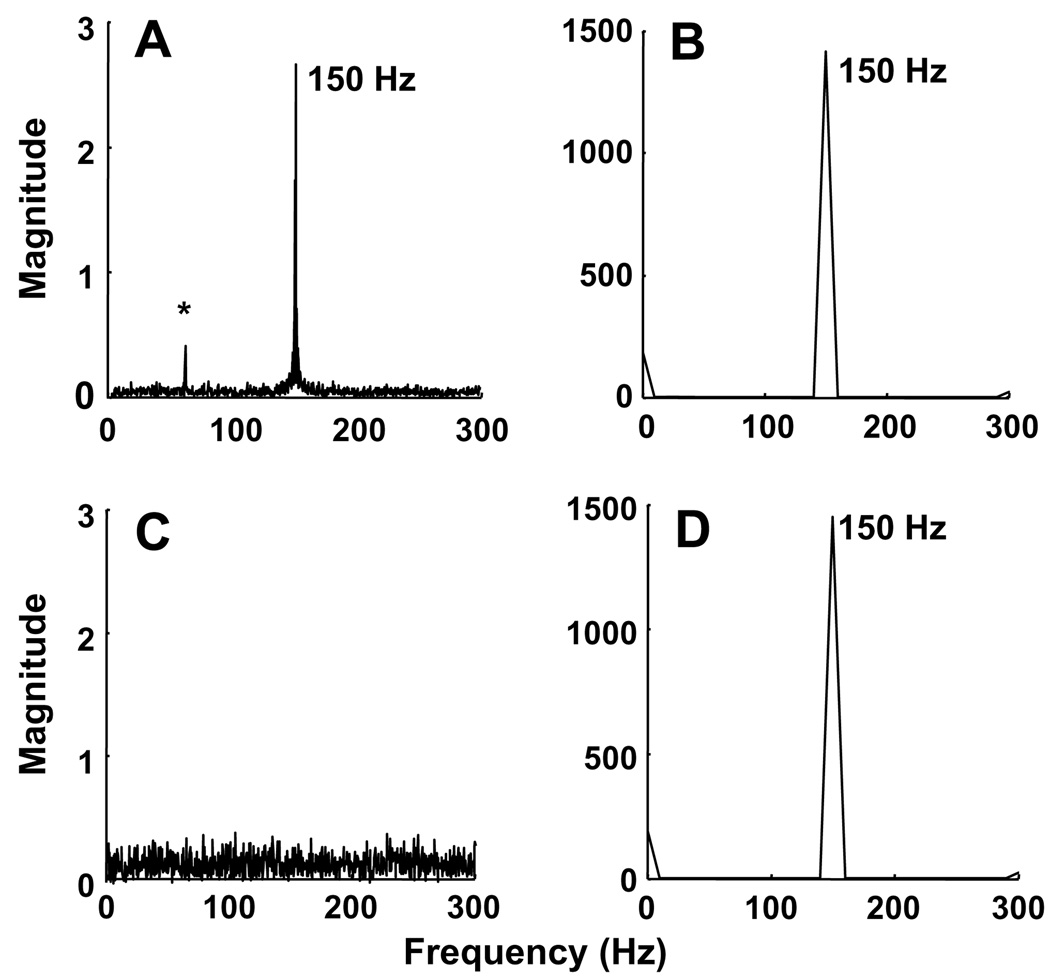
Fig. 4.
Fourier transform (FT) analysis of EPR and pressure-sensor data. The data were obtained from crystals of LiNc (A and B) or DPPH (C and D) subjected to 150-Hz pressure modulation. The EPR data of LiNc (A) show a peak at 150 Hz while that of DPPH does not show any peak (C) due its oxygen-insensitivity. The pressure-sensor data, however, show distinct peaks at 150 Hz. The ‘‘*” in (A) indicates a 60-Hz frequency originating from the signal channel at high receiver gains.

