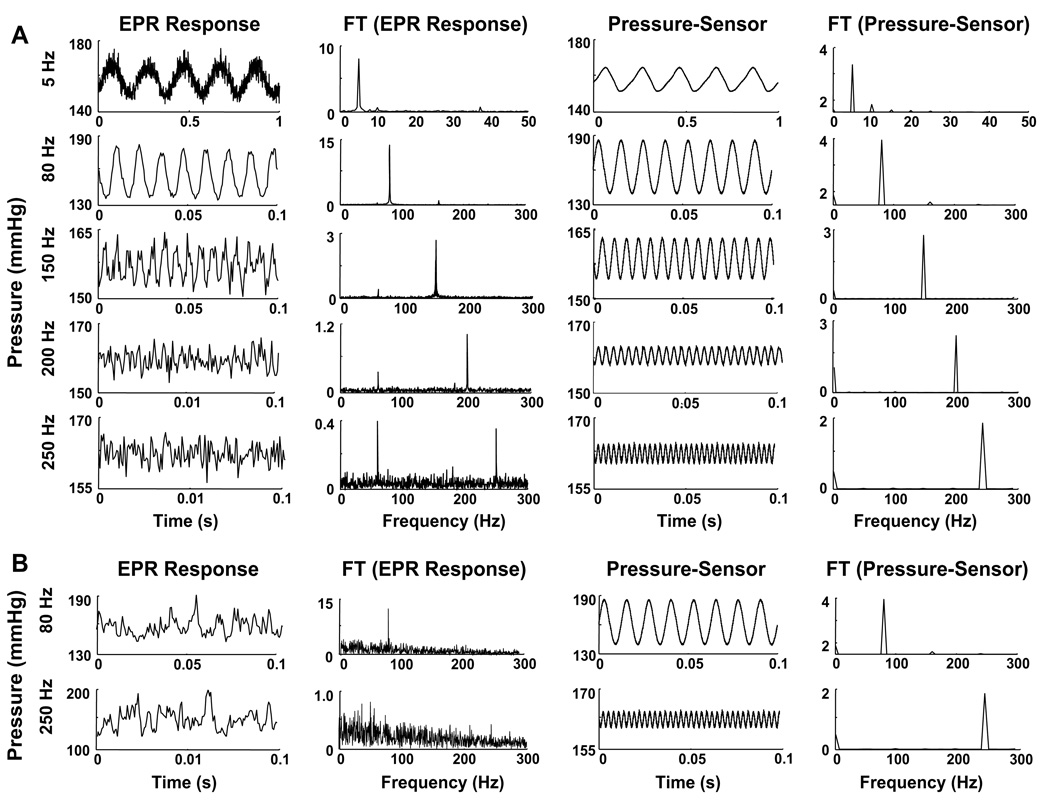
Fig. 5.
Response of pO2 and its FT measured using EPR and pressure sensor at different frequencies. (A) The data show that the pressure modulations in the chamber containing the probe (LiNc) are faithfully tracked by both EPR and pressure sensor at the frequencies tested. (B) Response of pO2 and its FT for LiPc-α-PhO. Unlike LiNc, the probe responds up to 150 Hz (6.7 ms). Thus, the absence of a peak in the FT of EPR data at 250 Hz can be seen.

