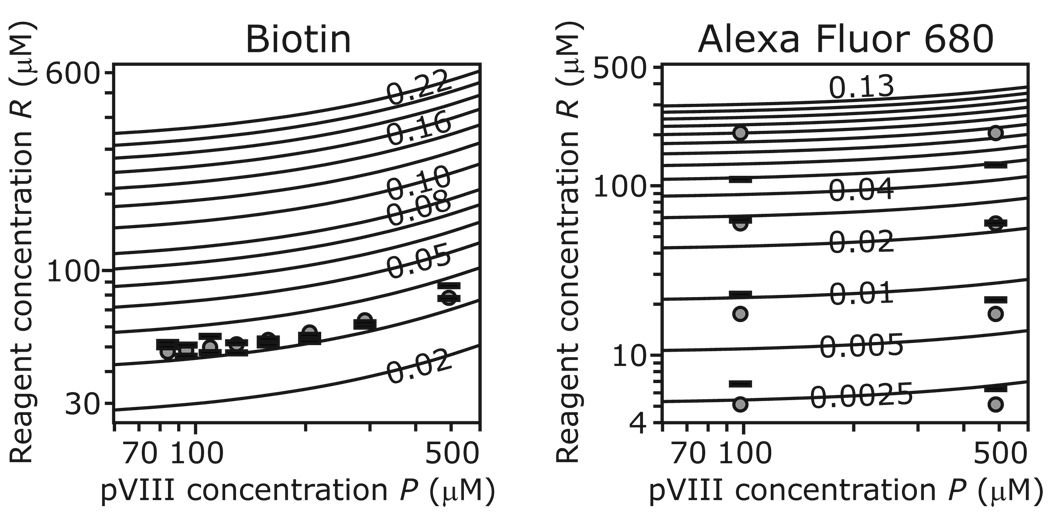
Figure 4. Modification of fd virions with NHS–PEO4-biotin (A) and sulfo-NHS-AF680 (B).
The solid lines are isomodification contours (for biotin: modification m = 0.02 to 0.08 in steps of 0.01 and 0.10 to 0.22 in steps of 0.02; for Alexa Fluor 680: m = 0.0025, 0.005 and 0.01 to 0.13 in steps of 0.01) as predicted by Equation 2 for the optimized values of the adjustable parameters given in Table 1. The open circles and horizontal bars represent the test reaction data used to optimize those parameter values, as explained in “Results and discussion”).

