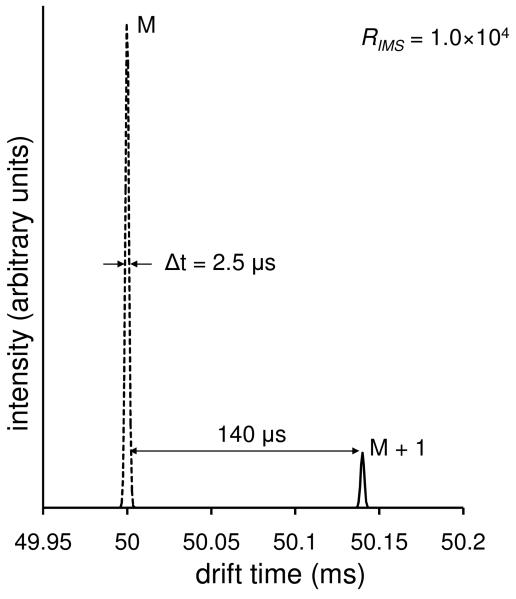
Figure 4.
Ion mobility distributions for isotopic peaks (M and M+1) for a hypothetical molecule. The dashed line corresponds to the isotopic peak of mass 100 Da and the solid line corresponds to the isotopic peak of mass 101 Da. The peak width (FWHM) of the first isotope is shown and the drift time range between isotopic peaks is given. A resolving power of 104 was used for these plots.

