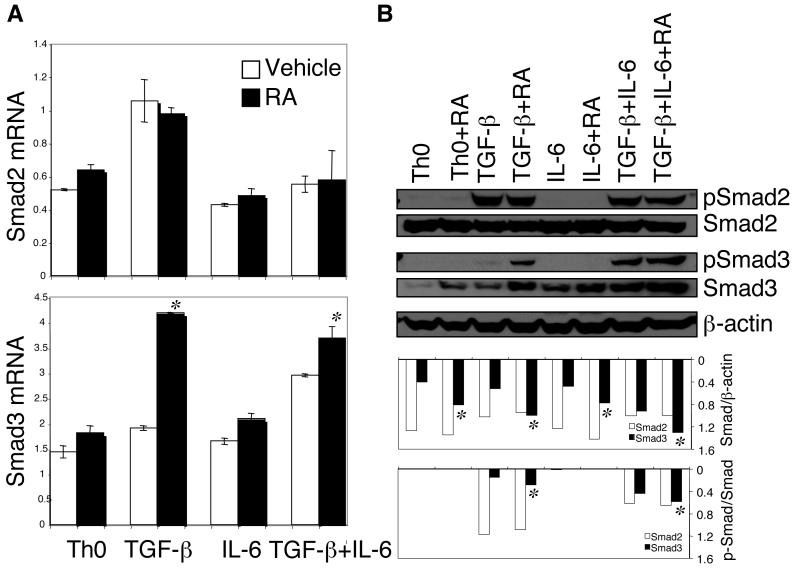
Figure 2. RA enhanced TGF-β-induced expression and phosphorylation of Smad3 but not Smad2.
Naïve CD4+ T cells were activated with anti-CD3 and anti-CD28 for 24 h under indicated conditions with or without RA. (A) Total RNA was isolated and expression of Smad2 and Smad3 mRNA was determined by Taqman quantitative PCR. (B) Cell lysates from indicated conditions were separated by SDS-PAGE gel, and total Smad and p-Smad were detected by immunoblotting. For quantification, the ratio of total Smad/β-actin and the ratio of p-Smad/total Smad were determined. Data are representative of three experiments. *, P <; 0.05 when RA treatment was compared to vehicle treatment.

