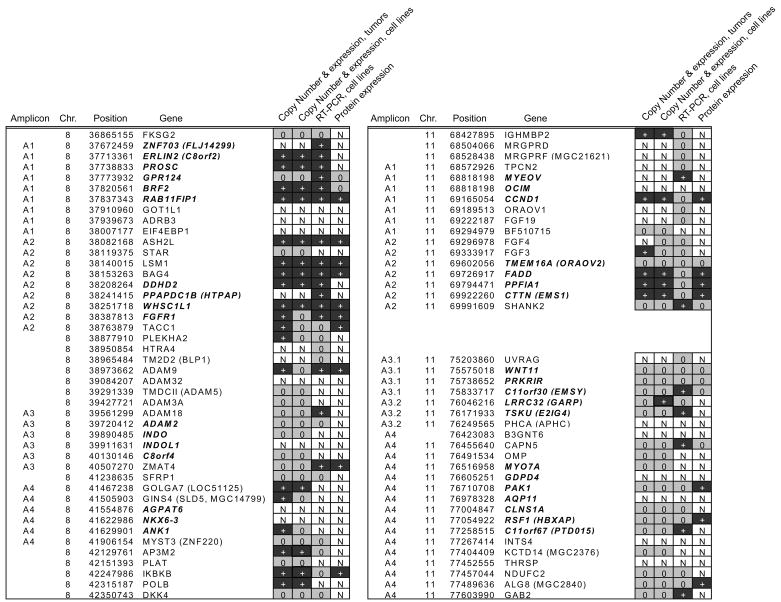
Figure 4.
Expression of candidate oncogenes in 8p12 and 11q13 amplicons. Genes in the amplicons are shown in genome order. The results of the expression analyses described in the text are shown from left right, correlation of copy number with expression in the breast tumor dataset, correlation of copy number with expression in the cell line dataset, transcript and protein levels in cell lines. + = significant positive correlation, transcript overexpression or protein overexpression, 0 = no correlation or overexpression, and N = not done.

