Figure 5.
Interaction between genes at 8p12 and 11q13.
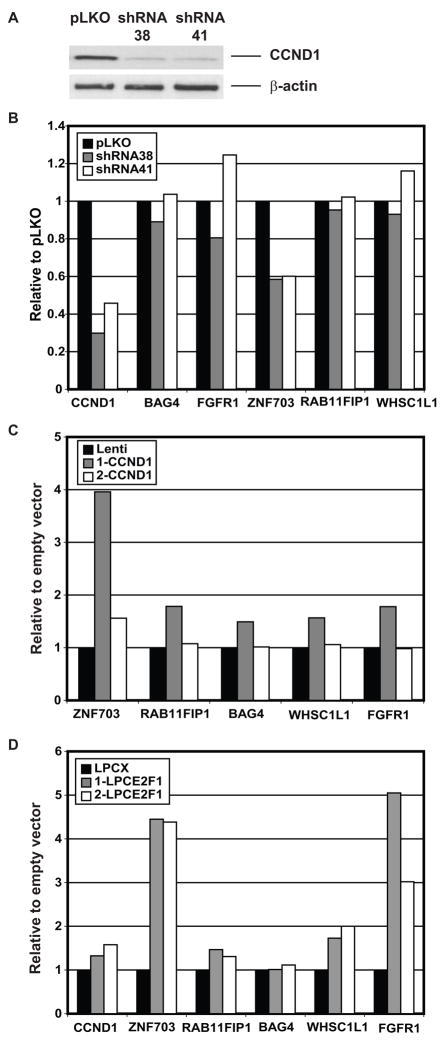
A. Knockdown of CCND1 by two shRNAs. Western blot showing decreased expression of CCND1 protein in SUM44 cells stably infected with either of two different shRNA lentiviruses 38 and 41 compared to a control shRNA pLKO (upper panel) and levels of β-actin on the same membrane (lower panel).
B. Transcript levels of genes normalized to GUSB in SUM44 cells expressing CCND1 shRNAs compared to SUM44 cells infected with empty vector (pLKO).
C. Transcript levels of genes normalized to GUSB in MCF10A cells overexpressing CCND1 compared to control MCF10A cells infected with an empty vector (Lenti). The results of two separate infections of MCF10A cells (1-CCND1 and 2-CCND1) are shown. Note that expression of CCND1 in 1-CCND1 was 2.7 times the level achieved in 2- CCND1. In both experiments, expression of ZNF703 was reproducibly induced to 5% of the level of expression of CCND1.
D. Transcript levels of genes normalized to GUSB in SUM44 cells infected with E2F1 expressing retrovirus compared to control cells infected with empty vector (LPCX). The results of two separate infections of SUM44 cells (1-LPCE2F1 and 2-LPCE2F1) are shown.

