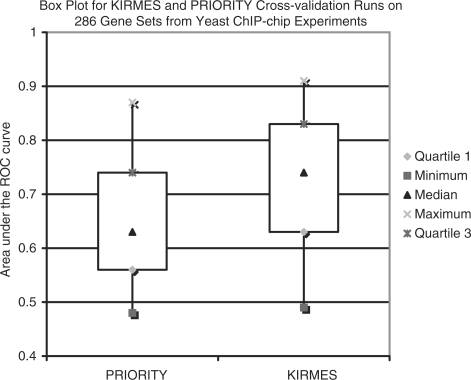
Fig. 5.
Comparison between the Gibbs sampler priority and the kirmes approach for the task of identifying genes regulated by a TF. The box plot shows the average auROC on the 268 gene sets, giving the minimum, maximum, median, first and third quartile values (cf. Sections 3.4 and 4.3).

