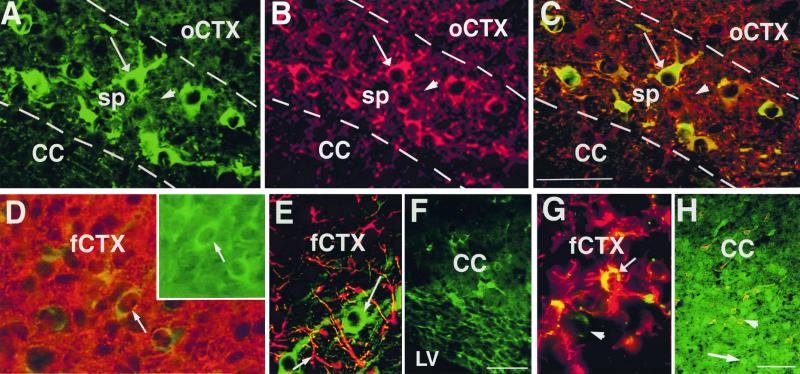
Figure 2.
The phenotype of transplanted GFP-NRP cells and GFP-GRP cells. Sections were double-labeled with antibodies against GFP to identify NRP (A–F) and GRP cells (G and H) and with neuronal markers MAP-2 (A–C), neuron-specific type III β-tubulin (D), the astrocyte marker GFAP (E and G), and the oligodendrocyte marker PLP-DM20 (F and H) are shown. The GFP is identified with an FITC-conjugated secondary antibody in all sections. (A–C) Representative section from the subplate showing NRP cells (A) and MAP-2 (+) cells (B). MAP-2 (+) NRP cells appear yellow (long arrows A–C). The arrowhead points to a MAP-2 (+)/GFP (−) host cell. (D) A representative confocal section from the frontal cortex shows some of the β-tubulin (+) cells in the cortex are GFP-NRP cells (yellow, arrow). (Inset) The same cell visualized with an FITC-filter (arrow). (E and F) Representative sections from either the frontal cortex (E) or corpus callosum (F) demonstrate that the NRP cells do not express either the astrocyte marker GFAP (E) or the oligodendrocyte marker PLP-DM 20 (F). (G) A representative field from the frontal cortex showing both GFP (+)/GFAP (+) (yellow) and GFP (+)/GFAP (−) (green, arrowhead) GRP cells. (H) A representative photomicrograph from the corpus callosum demonstrating some GFP-GRP cells expressing PLP-DM20 (yellow, short arrow) interspersed with GFP-GRP cells that do not (green, long arrow). These experiments therefore show that the NRP cells are committed to a neuronal lineage, whereas the GRP cells differentiate into glia only. CC, corpus callosum; sp, subplate; oCTX, occipital cortex; LV, lateral ventricle; fCTX, frontal cortex. (Bars = 100 μm.)

