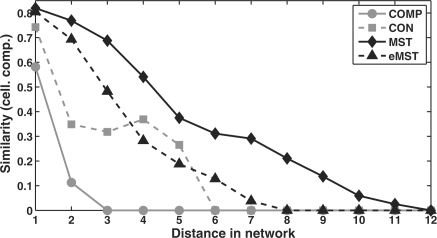
Fig. 3.
Correlation of the distance between a protein pair in the complete (COMP), connected (CON), MST and eMST networks to the fraction of GO cellular compartment annotations the two proteins have in common. Here, only GO terms corresponding to protein complexes were considered. Averages are taken over all protein pairs with the same distance. Subcomponent similarity increases at a distance of 4 for the connected network due to outliers among the few protein pairs with this distance.

