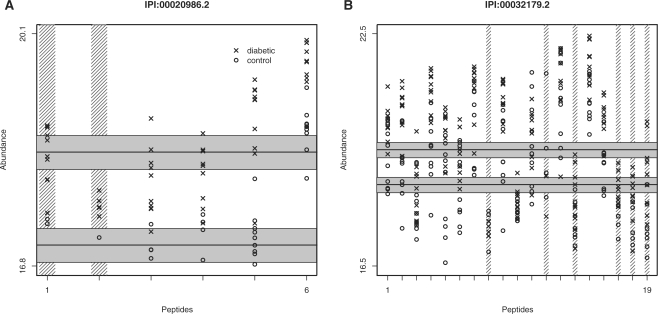
Fig. 1.
Peptide profiles for two proteins in the diabetes data that were found to be overexpressed in diabetics relative to controls: (A) lumican (IPI:00020986.2) and (B) an antithrombonin III variant (IPI:00032179.2). Note the peptide-specific baseline intensities, the apparent censoring of low intensities and the consistent group differences across peptides. The data have been log2-transformed. Peptides that have been shaded out vertically were filtered from the analysis due to poor data quality by our model-based filtering routine. The horizontal lines and shaded regions show our protein-level estimates for each group, as well as approximate 95% confidence intervals for those estimates.

