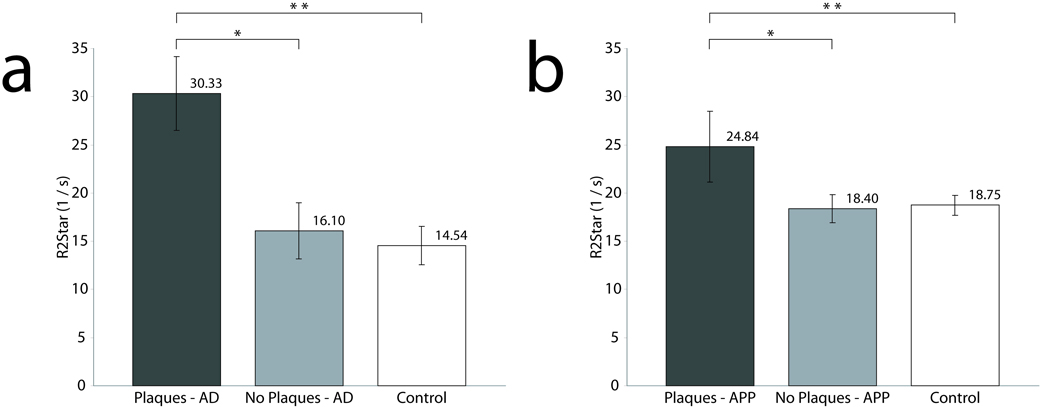
FIG 7.
Bar graphs of average R2* rates from ROI’s with plaques, without plaques and control tissue within human (a) and mouse tissue (b). The R2* relaxation rate of plaque ROI’s in the AD tissue is significantly higher than both regions without plaques and control tissue sections. A similar trend is found in mouse data. There is also a higher R2* relaxation rate for the plaque ROI’s in AD than in the APP/PS1 mouse, hypothesized to be due to higher iron in the AD plaques as shown with the Perl’s stain in Fig. 5 (b,d and e).

