Fig. 2.
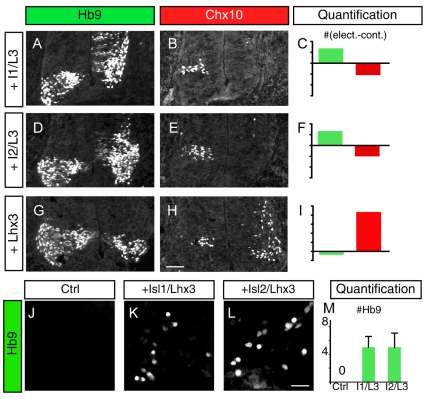
Combinatorial regulation of MNs and V2a neuronal identity. (A,B) Misexpression of Isl1 and Lhx3 in the chick neural tube induces ectopic Hb9+ MNs at the expense of Chx10+ V2a INs. Chick MN nuclei are labeled using Mnr2 antibody, which detects both Mnr2 and Hb9. The electroporated side is on the right and the control side is on the left. (C) Differences in the number of MNs (green) and V2a INs (red) between the electroporated and control sides of the neural tube are plotted. For MNs each unit on the y-axis corresponds to 100 cells, and for V2a INs each unit is 10 cells. (D-F) Overexpression of Isl2 and Lhx3 causes an increase in MNs and a decrease in V2a INs, similar to Isl1 and Lhx3 overexpression. (G-I) Misexpression of Lhx3 triggers V2a IN development and inhibits MNs. (J-L) Transfection of Isl1+Lhx3 (K) or Isl2+Lhx3 (L) expression constructs into P19 cells induces Hb9. (M) Quantification of Hb9-expressing cells within the field of view (FOV). Each bar represents the average of at least five FOVs collected from two different experiments. Mean±s.e. is shown. Scale bars: in H, 50 μm for A,B,D,E,G,H; in L, 17 μm for J-L.

