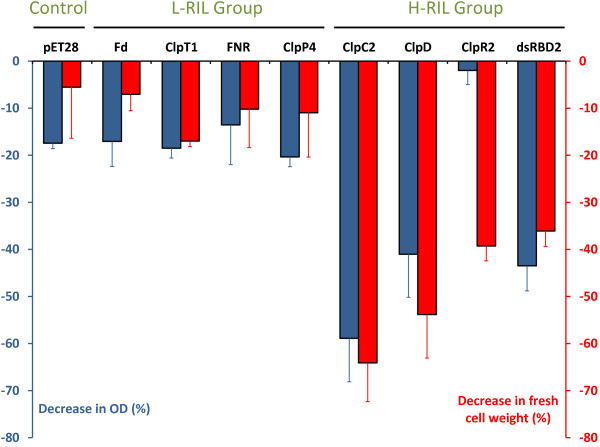
Figure 1.
Effect of protein expression on CP cells growth. Cells carrying each plasmid were grown at 25°C for 6 h as described in Methods. Blue bars show the percentual change in final OD600 while red bars show percentual change in fresh cell weight of the induced culture vs the uninduced culture. Each bar represents the mean (plus error bars) of three independent experiments.

