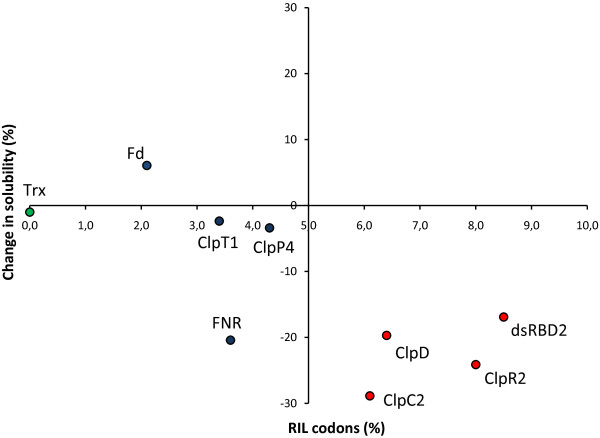
Figure 5.
Change in solubility of target proteins as a function of RIL codon content. Change in solubility indicates the difference of the percentage of soluble protein in the CP strain with respect to the percentage of soluble protein in the BL strain. Blue dots, L-RIL proteins; red dots, H-RIL proteins; green dot, thioredoxin.

