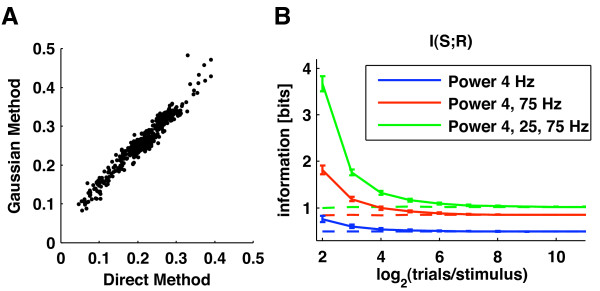
Figure 5.
A comparison of Gaussian and Direct information estimation on V1 LFPs. A: This panel compares the values of information about naturalistic movies carried by V1 LFPs with the Gaussian and the Direct methods. It shows a scatter plot of the information conveyed about the movie by a single LFP frequency computed either with the Gaussian Method, or as a Direct estimate with data discretized into 8 bins. Data were taken from channel 7 of session D04 of the dataset reported in Ref. [29]. Each dot represents an information value obtained at a different LFP frequency with the two techniques considered. This figure shows that, on this dataset, the Gaussian and the Direct calculations provide similar values. The Pearson correlation coefficient between the values computed with the two methods was 0.99. B: We tested the Gaussian estimates of information on simulated data. We generated simulated LFPs which matched the second order statistics of LFPs recorded from primary visual cortex during visual stimulation with color movies (see Appendix A). The neural response r used to compute information was either a one, a two or a three dimensional response array containing the simulated LFP power at frequencies of 4, 25 and 75 Hz. The estimates of the mutual information carried by the power at either one, two or three frequencies were computed using these data and the Gaussian Method and was plotted as function of the generated number of trials per stimulus (mean value ± the standard deviation over 50 simulations). Solid lines and dotted lines represent Gaussian estimates obtained without and with the subtraction of the analytic gaussian bias correction (see text) respectively.

