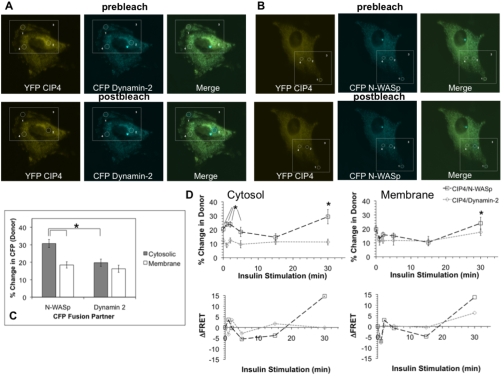
Fig. 5.
Kinetic and spatiotemporal assessment of CIP4–Dynamin-2 and CIP4–N-WASp insulin-dependent interactions by apFRET. Representative images are shown for L6 GLUT4myc co-transfected with (A) YFP CIP4 or CFP Dynamin-2 or (B) YFP CIP4 or CFP N-WASp. ROIs for photobleaching were defined for membrane (ROI 1) and cytosolic (ROI 2) regions. Control (ROI 3) and scanning (ROI 4) regions were also defined to assess the extent of off-target bleaching. (C) Increases in donor (CFP) intensity after acceptor (YFP) photobleaching of subcellular compartments were measured for cells under standard culture conditions. All values are presented as mean ± s.e.m. for a minimum of 12 measurements. The asterisk indicates linked, statistically different pairs (P<0.05). (D) Dynamic changes in protein-protein interactions were assessed by apFRET during insulin stimulation of L6 GLUT4myc myoblasts. Cells were starved for 5 hours and exposed to 100 nM insulin for the times indicated. After each time-point, specimens were fixed in 4% paraformaldehyde and mounted for apFRET. Following collection of all data points for both co-transfection conditions rates, changes in FRET efficiency between fluorophores were calculated as described in the Materials and Methods. Time-course data were further transformed into derivative representations. Each time-point is a minimum of 11 measurements ± s.e.m. Asterisks indicate statistically different pairs of means (P<0.05).

