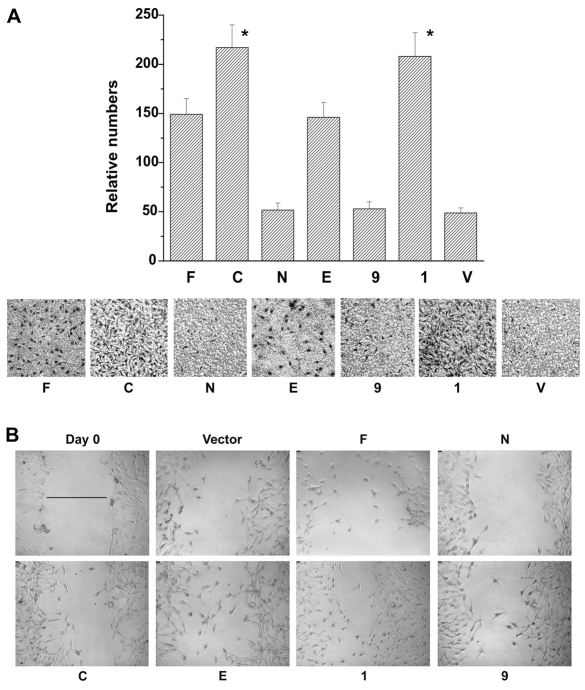
Fig. 7.
IQGAP1 regulates cell migration. (A) Top, quantification of the number of migrated stable NIH3T3 cells with the Boyden assay. Means ± s.e.m. are shown for n=3 experiments (*P<0.001). Migration rates of IQGAP1-C and the phosphodefective mutant (I) cells were significantly greater than that of control cells. Lower, representative photomicrograph of migrated cells stained with Giemsa (dark spots). (B). Wound-healing assay of the indicated NIH3T3 stable cell lines. The scratched monolayer was photographed immediately (Day 0, is representative of all cells) and after 12 hours. Scale bars: 10 μm (upper left). For quantification of the migrated distances, see supplementary material Fig. S1A. The line in Day 0 was used as reference to calculate the migrated distances of the cell lines.

