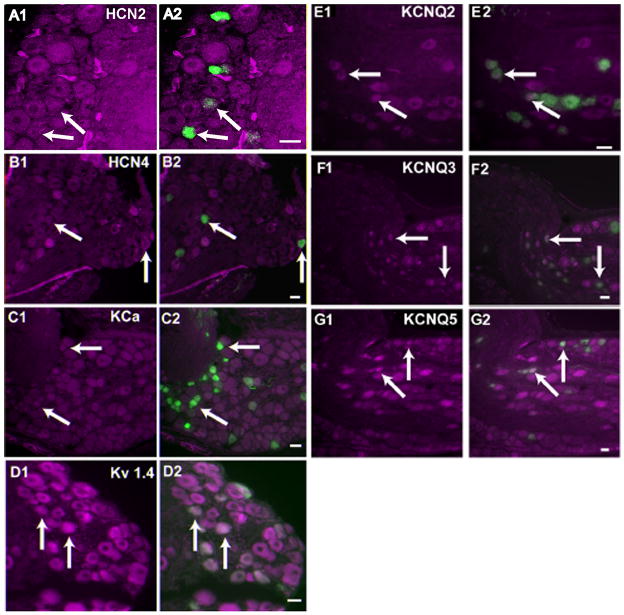
Figure 3. Co-expression of tyrosine hydroxylase with KCNQ2, KCNQ3, KCNQ5, KCa, Kv1.4, HCN2 and HCN4 in neurons of the petrosal ganglion.
The left panel for each antibody demonstrates ion channel immunoreactivity psuedocolored in magenta. The right panels are the resultant overlay of TH immunoreactive neurons (green) whose afferent fibers terminate on the glomus cells. Arrows identify some of the cells exhibiting both TH and the ion channel immunoreactivity. Panel A1, A2: HCN2 (NeuroMab); Panel B1, B2: HCN4; Panel C1, C2: Kca (NeuroMab); Panel D1, D2: Kv1.4; Panel E1, E2 : KCNQ2 (NeuroMab); Panel F1,F2: KCNQ3; Panel G1, G2:KCNQ5. Scale in all the panels = 15um

