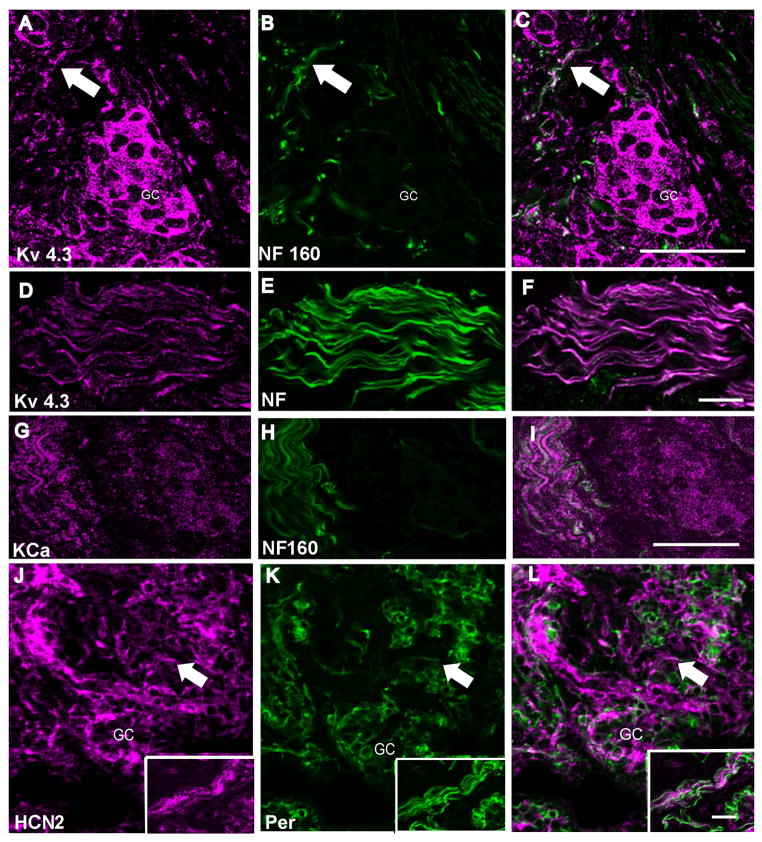
Figure 5. Distribution of Kv4.3, KCa, and HCN2 immunoreactivity in the carotid body nerve fibers.
In all panels the left image is the ion channel immunoreactivity pseudo-colored in magenta, the center image illustrates anti-NF, anti-NF160 or anti-peripherin (green). The right image is a merge of the two images. Panel A–C is a confocal Z-series stack demonstrating the distribution of anti-NF160 and anti-Kv4.3. The arrow illustrates one example of co-localization in fibers in the carotid body. The individual glomus cells are highly immunoreactive for Kv4.3 making it impossible to distinguish between innervating fibers and cell bodies within the cluster. Scale = 50μm. Panel D–F is a high magnification confocal z-series of the carotid sinus nerve as it enters the carotid body where there is almost total overlay of Kv4.3 and the neurofilament cocktail. Scale = 20μm. Panel G–I, a single confocal image from a z-series, demonstrates at high magnification KCa channel immunoreactivity in a group of carotid sinus nerve fibers adjacent to a glomus cell cluster. The glomus cell cluster shows very punctuate labeling in this single image. Similar results were obtained with the two antibodies listed in Table 1. Scale = 50μm. Panel J–L is a low magnification confocal slice showing the co-localization of anti-HCN2 (Alomone) and anti-peripherin (Santa Cruz). The inset shows a labeled group of CSN fibers. HCN2 immunolabeling does not appear to include the glomus cells although it co-localizes with peripherin in the fibers on the edge of the cluster and, in a few fibers, appears to penetrate the clusters. However, it is most intense in surrounding cells that do not label with anti-peripherin, probably Type II cells. Scale = 25μm. GC=glomus cell cluster.

