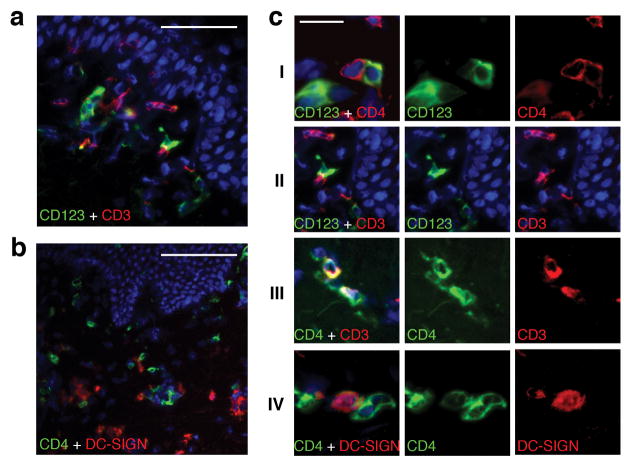
Figure 5. Interactions of DCs and CD4+ T cells in post-healing biopsies during acyclovir treatment.
(a) Dual immunofluorescence staining of CD123 with CD3 showing the interaction of CD123+ cells (green) and CD3+ T cells (red) in a week 12 post-healing biopsy while on acyclovir therapy. (b) Associations of CD4+ cells (green) with cells expressing DC-SIGN (red). Biopsy was taken after 20 weeks of acyclovir therapy. (c) Detailed micrographs illustrate direct interaction between CD123+ DCs and CD4+ T cells, and DC-SIGN+ DCs and CD4+ T cells at genital lesion site post healing. Panel I shows CD123+ DC are contiguous to CD4+ T cells. Panel II shows interactions between CD123+ DC cells and T cells. Panel III illustrates clusters of CD3+CD4high T cells and CD3-CD4low DCs. Panel IV shows a CD4+ T cell contiguous to a DC-SIGN expressing cell scale bar:50μ(a), 100μ(b), 20μ(c).

