
Figure 2. LC/MS metabolite discovery tools.
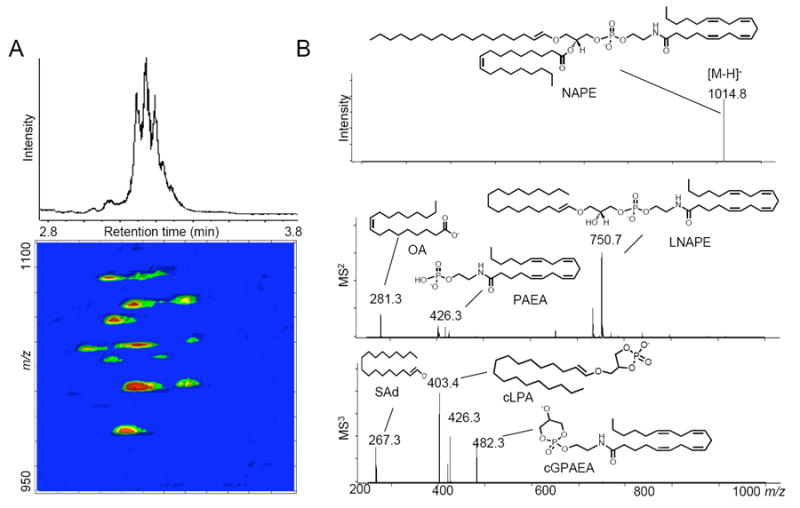
A, Representative total ion LC/MS chromatogram of a mixture of isobaric and isomeric N-acyl phosphatidylethanolamine (NAPE) species (top). A 3D LC/MS contour mapping (bottom) visualizes individual molecular species present in the mixture. The first dimension is elution time, the second is mass-to-charge ratio (m/z) and the third relative intensity of the signal, which is symbolized with a pseudocolor scale. LC/MSn conditions are those previously reported [12]. Three-dimensional maps were generated using MS Processor from Advanced Chemistry Development, Inc. (Toronto, Canada). B, Representative ESI/MSn analysis of N-arachidonoyl phosphoethanolamide species in the rat brain. MS2 and MS3 lead to fragment ions that are found physiologically as neutral molecular species: lyso-NAPE (LNAPE), phosphoanandamide (PAEA), oleic acid (OA), stearic aldehyde (SAd), cyclic-lysophosphatidic acid (cLPA) and a cyclic glycerophospho-anandamide (cGPAEA, which has not yet been identified in mammals).