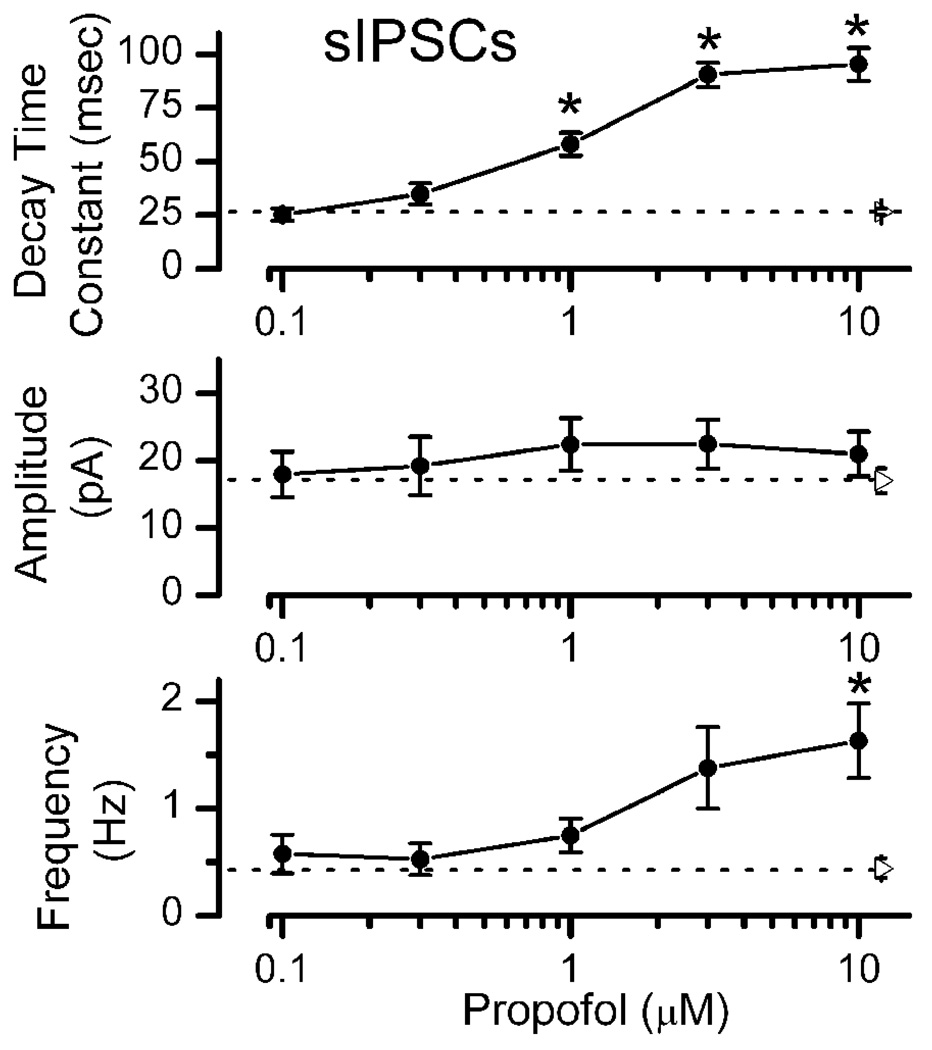
Figure 5.
Summary of propofol concentration-response relationships for sIPSC event characteristics. Decay time constant of sIPSC increased at ≥1 µM propofol. Amplitudes of sIPSC were unaltered by propofol (p>0.7) but sIPSC frequency increased in 10 µM propofol. Filled circles are means ± SEM. Right pointing triangles and broken lines indicate the Control mean value ± SEM for each parameter (n=17). Means in each condition were based on 5–17NTS neurons and significant differences from Control are noted with asterisks (Repeated Measures ANOVA with Holm-Sidak method of post hoc pairwise comparisons at p<0.05).

