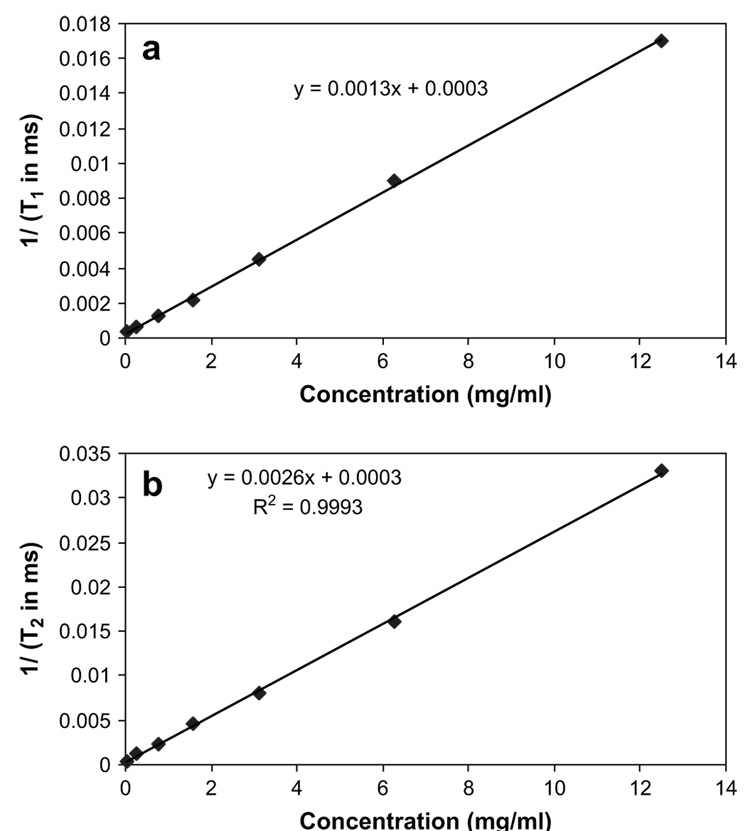
Fig. 1.
(a) Relationship between the inverse of relaxation time (T1) and Galbumin™ concentration. (b) Relationship between the inverse of relaxation time (T2) and Galbumin™ concentration. The relaxation times T1 and T2 were determined by curve fitting of the signal intensity with respect to the time variables TR and TE using equation (3). For T1 measurement, MRI images were acquired at 50, 100, 200, 400, 800, 1600, 2400, and 3200 ms TR with TE fixed at 13 ms. For T2 measurement, TE was 9, 18, 27, 36, 45, 54, 63, 72, and 82 ms with TR fixed at 3000 ms.

