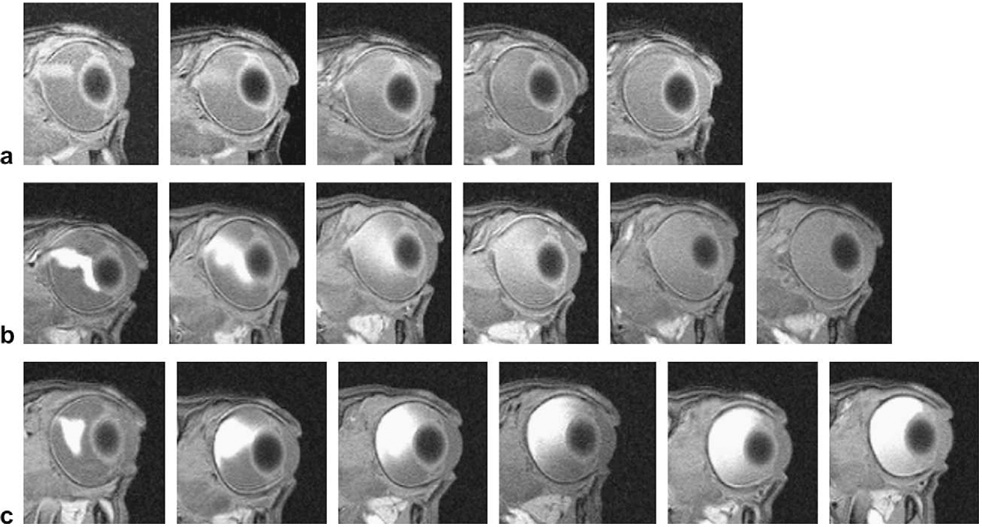
Fig. 4.
Representative MR images after intravitreal injection of (a) 0.25, (b) 1, and (c) 4 mg/ml Galbumin™ in vivo. From left to right: (a) at 20 min, 4 h, 7 h, 12 h, and 22 h, (b) at 20 min, 4 h, 13 h, 23.5 h, 39.5 h, and 58.5 h and (c) at 20 min, 4 h, 13 h, 23.5 h, 39.5 h, and 58.5 h, respectively.

