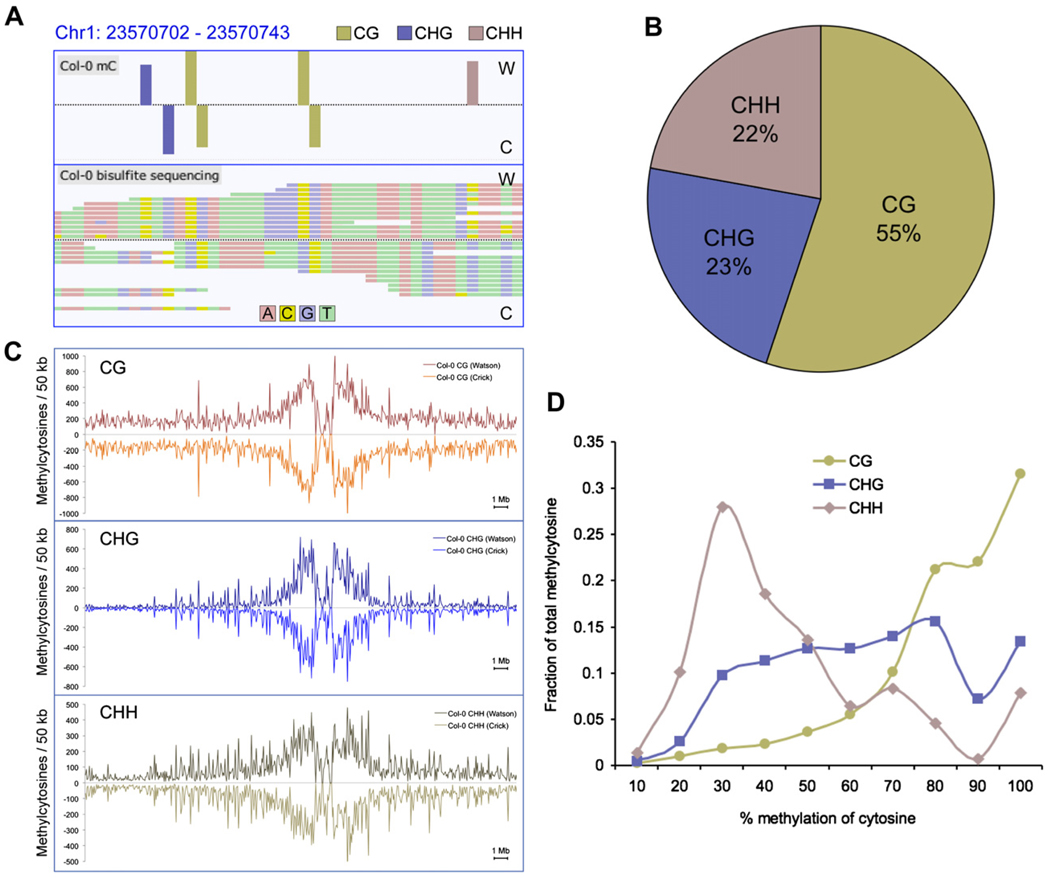
Figure 1. DNA Methylation Context and Chromosomal Distribution in Wild-Type Col-0.
(A) Methylcytosines identified (top panel) in Col-0 from bisulfite-converted sequencing reads (bottom panel) for a region of chromosome 1, as represented in the AnnoJ browser.
(B) The fraction of methylcytosines identified in each sequence context for Col-0, where H = A, C, or T.
(C) The density of methylcytosines identified in each context, on each strand throughout chromosome 1, counted in 50 kb bins.
(D) Distribution of the percentage methylation at each sequence context. The y axis indicates the fraction of the total methylcytosines that display each percentage of methylation (x axis), where percentage methylation was determined as the fraction of reads at a reference cytosine containing cytosines following bisulfite conversion. Fractions were calculated within bins of 10%, as indicated on the x axis.

