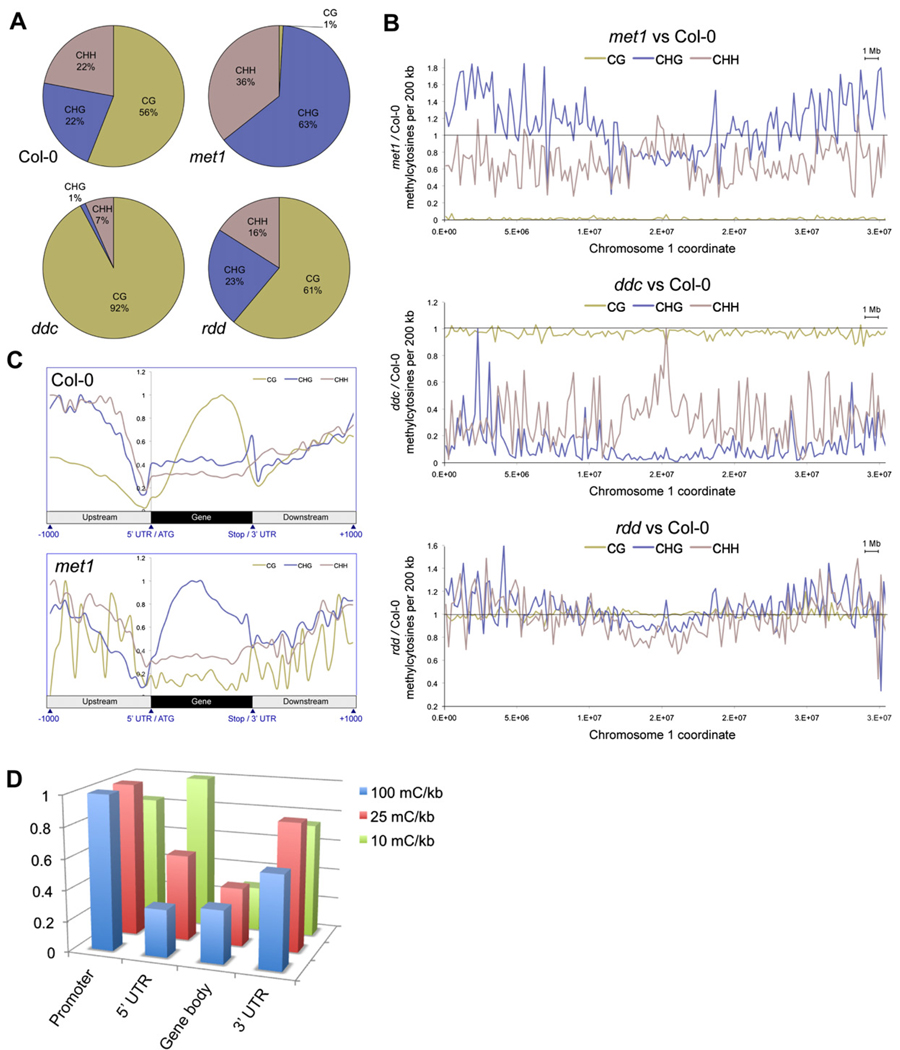
Figure 3. Methylation in DNA Methyltransferase and DNA Demethylase Mutant Plants.
(A) The fraction of methylcytosines in each sequence context for each genotype. Positions were compared only where all genotypes had a sequence read depth between 6 and 10.
(B) Ratio of the number of methylcytosines in each mutant versus Col-0 per 200 kb, where read depth was 6–10. The horizontal line represents Col-0, the plotted line represents percentage methylation in the mutant versus Col-0.
(C) Average distribution of DNA methylation in each context throughout genes and 1 kb upstream and downstream in Col-0 and met1. Values are normalized to the highest point within each profile.
(D) Density of sites of hypermethylation in rdd. The number of sites of DNA methylation present in rdd and absent in Col-0 was tabulated for promoters (1 kb upstream), 5′UTRs, gene bodies, and 3′UTRs, and the density of methylation in each normalized to the length of each feature. The number of features that contained hypermethylation above different lower thresholds of density was calculated, and the number of features of each type normalized relative to the feature with the most counts, for each lower threshold.

