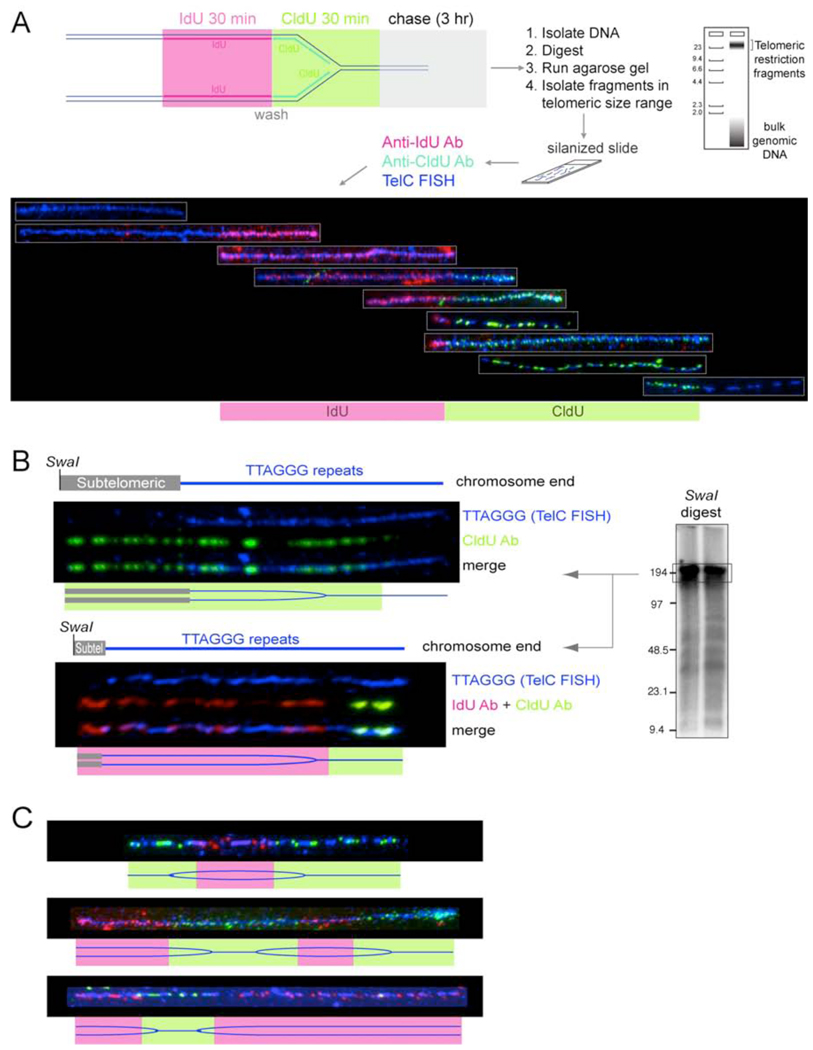
Figure 4. SMARD analysis of telomere replication in wild type cells.
(A) Top: schematic depiction of the SMARD protocol to visualize the replication of single telomeric DNA molecules. See text for description. Bottom: Telomeric DNA molecules of variable lengths identified by telomeric FISH (TelC; blue) with incorporated IdU and CldU detected with fluorescent antibodies (red and green, respectively). The telomeric fragments are organized assuming that replication proceeds from a subtelomeric origin towards the chromosome end.
(B) Two examples of replication fork progression towards the chromosome end. SMARD on ∼180-kb telomeric DNA SwaI fragments containing subtelomeric DNA of variable lengths. Procedure as in (A) except that the DNA was digested with SwaI and the DNA was resolved on a pulse-field gel (see genomic blot inset). Duration of the IdU and CldU pulses was 1 hour each. The pattern is consistent with replication forks progressing from a subtelomeric origin towards the chromosome end as depicted in the cartoon below each SMARD image.
(C) Examples of three telomeric molecules with IdU/CldU incorporation patterns consistent with replication initiating in the TTAGGG sequence. Procedure as in (A).

