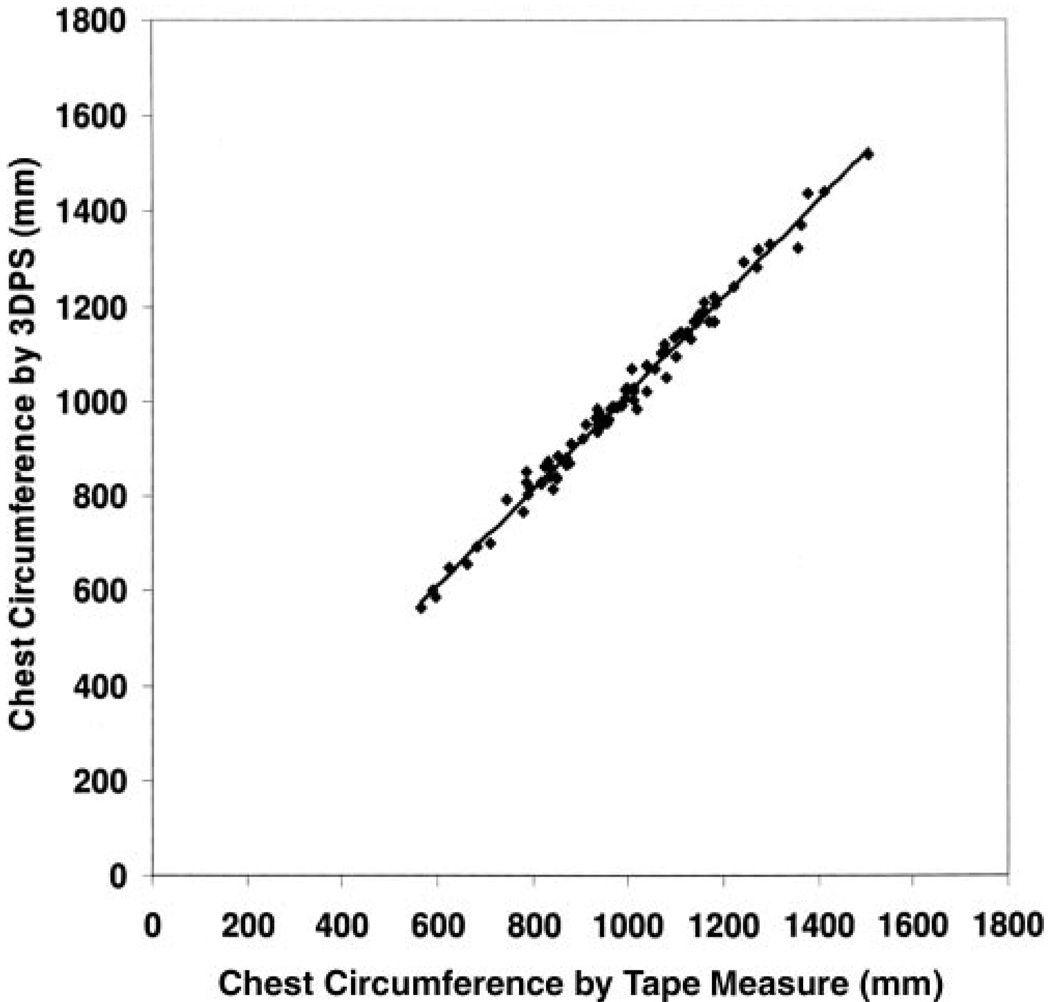
Figure 4.
Scatter plot of chest circumference measured by 3-dimensional photonic image scanning (3DPS) and a tape measure in 89 of 92 human subjects [45 normal-weight subjects (12 children) and 44 obese subjects (12 children)]. The following equation was obtained by linear regression: y = 1.0135x + 2.6327 (r2 = 0.9889, SEE = 21.064 mm).

