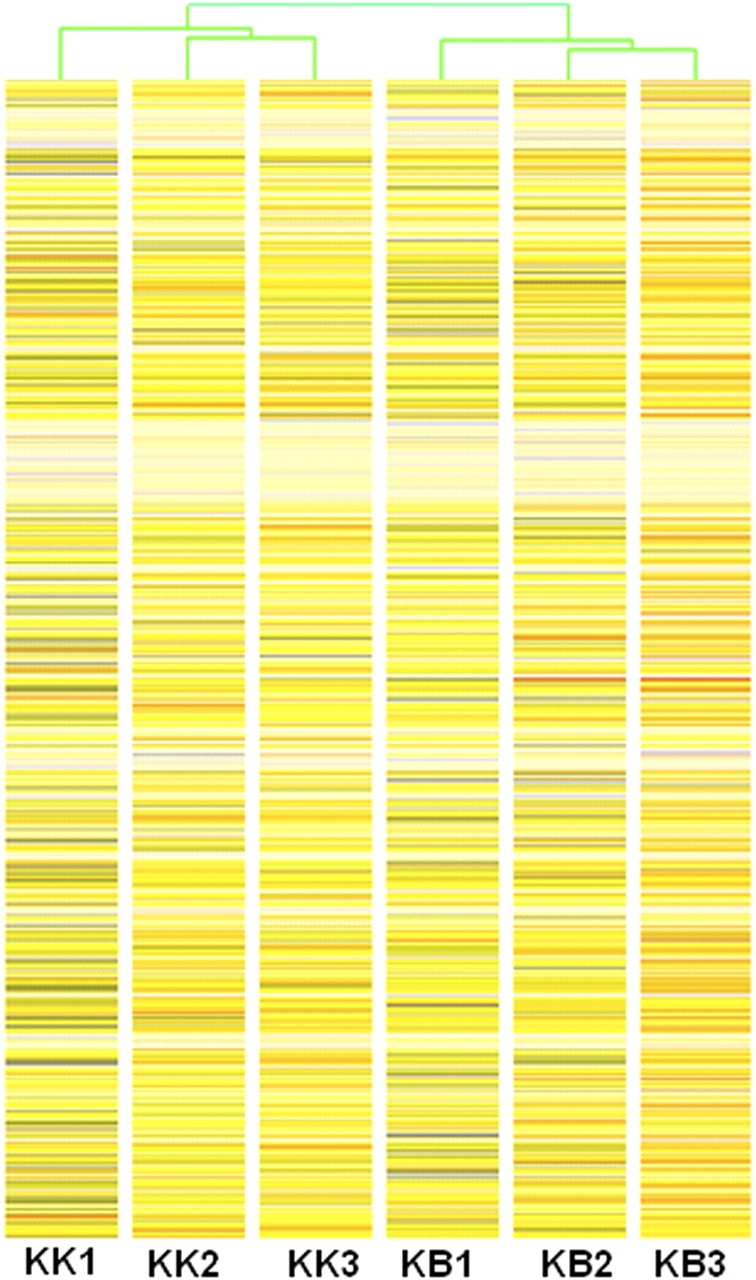
FIG. 2.

Hierarchical clustering analysis of sample replicates based on transcript levels in each of three replicates of 30 embryos each from the cross DDK × DDK (KK1, KK2, and KK3 on the left) and from the cross DDK × C57BL/6 (KB1, KB2, and KB3 on the right).
