
Figure 2.
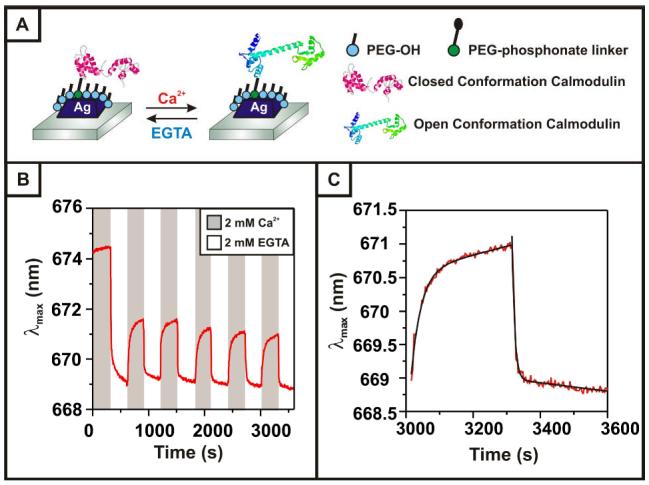
(A) Schematic of the experimental setup for conformational cycling of CutCaMCut immobilized on the LSPR nanosensor. (B) Plot of changes in the extinction maximum (1 Hz collection) of the sensor as the buffer is cycled between 2 mM CaCl2 and 2 mM EGTA, a calcium chelator. (C) Closeup of one CaCl2/EGTA cycle, with an exponential fit of λmax = λmax(0) + Aexp(-t/τ) +B*t (black) to the experimental data (red), where τ(open)=30 s, τ(close)=8 s, and B<0.0013 nm/s.