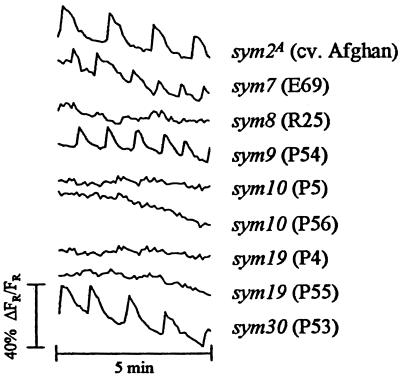
Figure 3.
Changes in intracellular calcium in the root hairs of pea nodulation mutants. Traces are from individual root hairs 10 min after addition of 10−8 M Nod factor and are representative of the typical responses seen (see Table 1). The label after each trace indicates the mutant gene of interest, with the line number in parentheses. Each trace represents data collected from 60 images, one image taken every 5 s. Measurements were taken from the nuclear regions of the cells. At least six cells were examined from six root sections for mutants showing no response.

