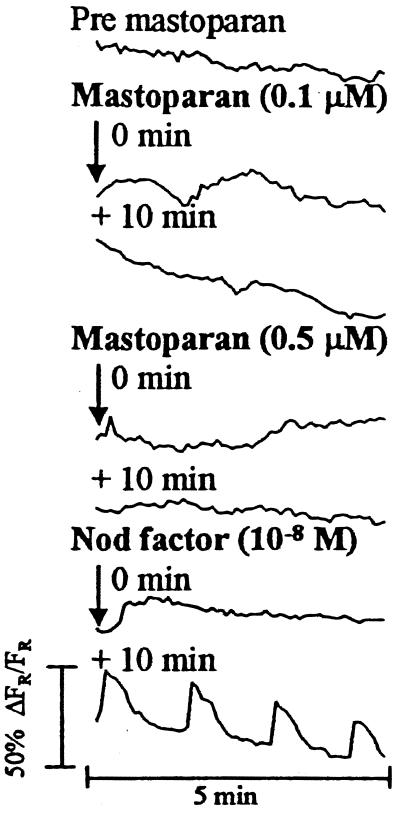
Figure 5.
Calcium response of a pea root hair injected with Oregon Green and exposed to various concentrations of mastoparan. The trace is taken from one root-hair experiment and represents the typical response seen (n = 5). Measurements were taken from the nuclear region of the hair. Each trace represents data collected from 60 images, one image taken every 5 s. The time label on each trace indicates when the first image for that set was taken relative to the addition of Nod factor or mastoparan

