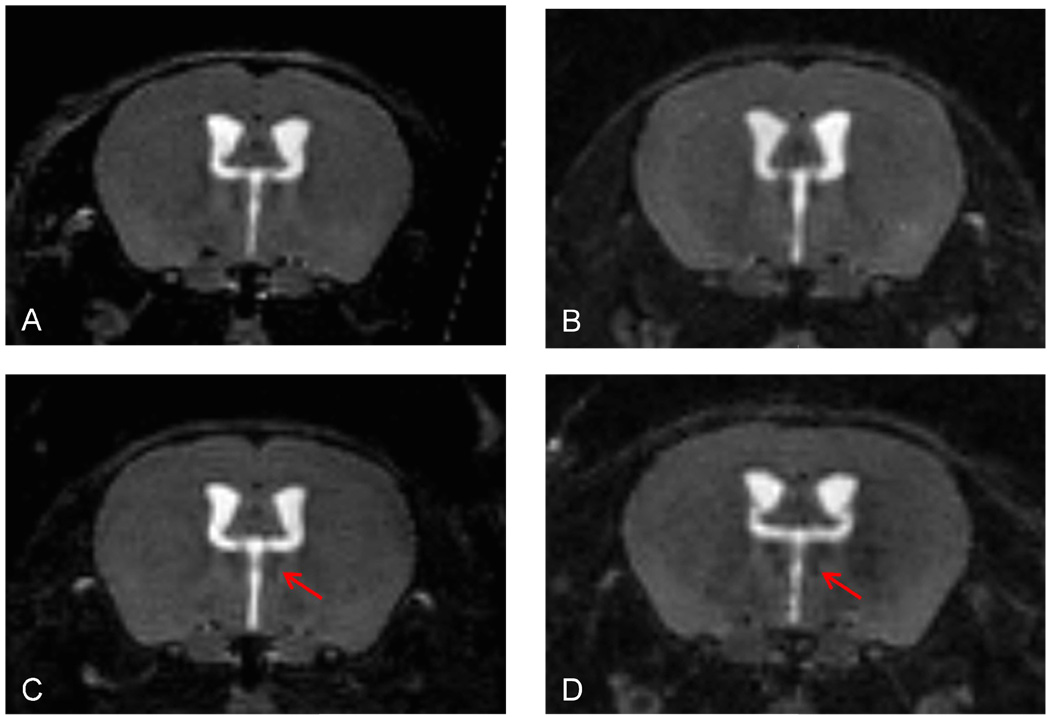
Fig. 2. Example of progressive thalamic T2 hypointensity at 1 (A), 4 (B), 6(C) and 12 (D) months post disease induction.
A–D represent coronal slices of the section where the hypointensity was measured, as shown on Figure 1. The above images were extracted from the original 3D datasets. Note the hypointensity of the medio-dorsal thalamic nucleus and the increasing hypointensity at the later time points (arrows).

