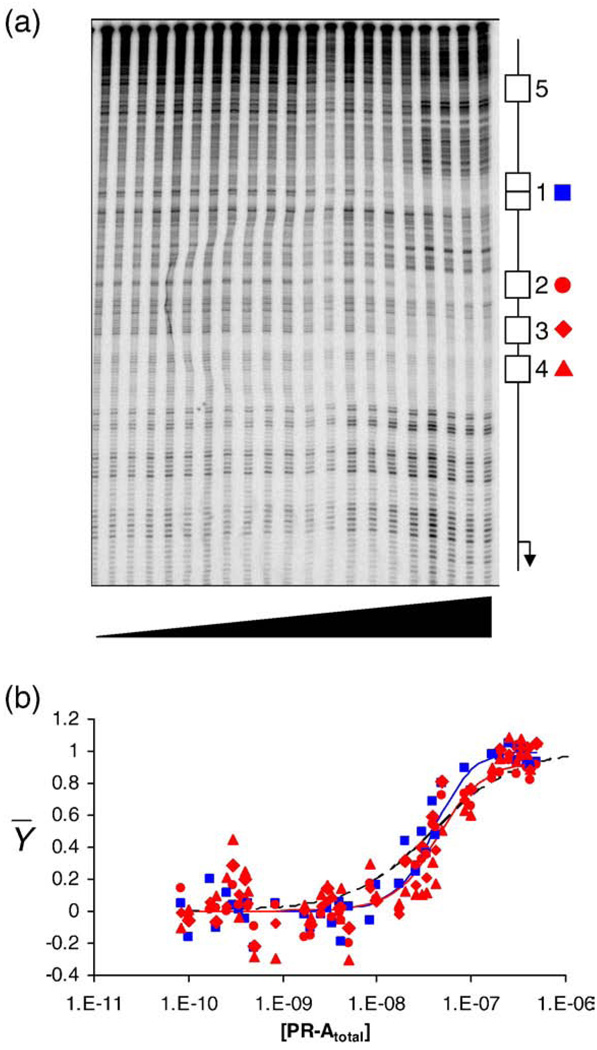
Fig. 2.
Quantitative footprint titration of the wild-type MMTV promoter and individual-site binding isotherms. (a) Representative footprint titration of the MMTVwt promoter. PR-A concentration increases from left to right. A schematic of the canonical PRE binding sites (sites 1–4) and the cryptic site (site 5) is shown on the right. Symbols used to represent binding to each site in all footprints are as follows: blue squares, site 1; red circles, site 2; red diamonds, site 3; red triangles, site 4. (b) Fractional saturation of sites 1–4 on the wild-type promoter as a function of total PR-A concentration. Symbols are as described in (a). Continuous lines represent a global analysis of all seven MMTV templates using the microscopic model described in the text. The blue line represents binding to the palindromic site 1. The red line represents binding to a single half-site; only one line is shown since the energetics of binding to each half-site are identical. The black broken line represents a noncooperative, Langmuir binding isotherm.

