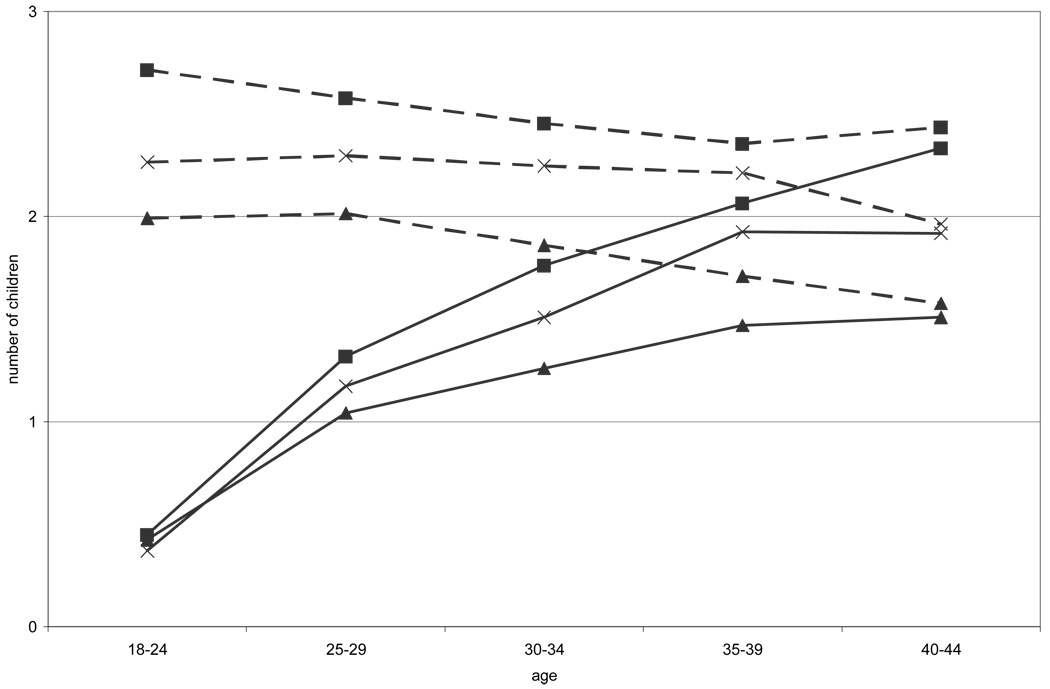
Figure 1. Actual and Intended Total Fertility, By Importance of Religion.
Dashed lines=mean intended fertility; solid lines=mean children ever born. Square=religion very important; x=religion somewhat important; triangle=religion not important/no religion. Data: 2002 NSFG. Means weighted using sample weights.

