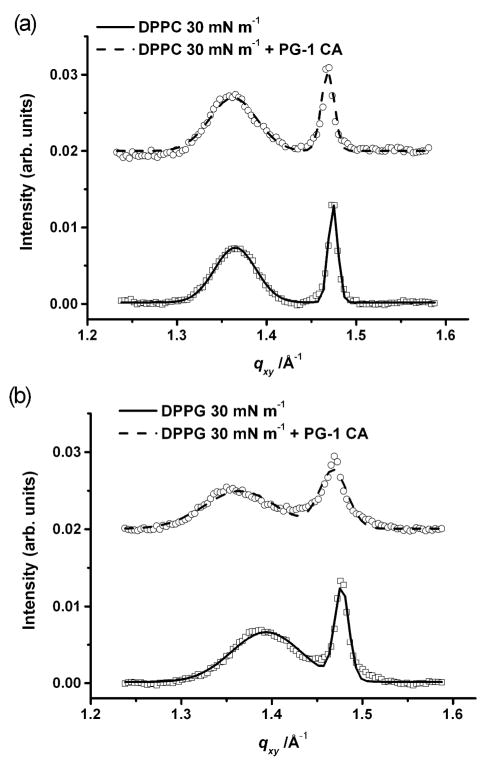
Fig. 2.
Bragg peak plot of scattering vector qxy as a function of intensity monolayers at 30 mN m−1. A) Data (□) and fit (—) of DPPC monolayer at 30 mN m−1; data (○) and fit (---) of DPPC monolayer after 0.025 mg ml−1 PG-1 injection into the subphase; B) Data (□) and fit (—) of DPPG monolayer at 30 mN m−1 (—); data (○) and fit (---) of DPPG monolayer at 30 mN m−1 after 0.025 mg ml−1 PG-1 injection into the subphase. For clarity the data have been offset vertically.

