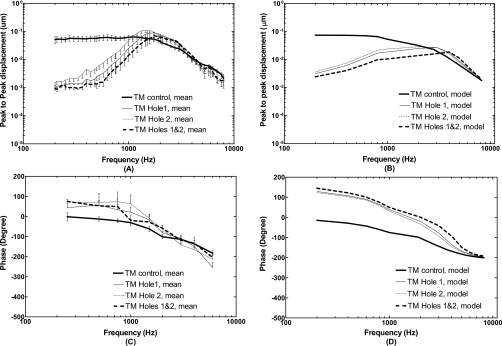
Figure 5.
Mean displacements with standard errors (N=5) measured at the TM (umbo) and calculated from the FE model in control or intact TM (thick solid lines), perforations Hole 1 (thin solid lines), Hole 2 (thin dashed lines), and combined Holes 1 and 2 (thick broken lines). The input sound pressure level was 90 dB at 2 mm from the umbo in the ear canal. [(A) and (C)] Bone experiments; [(B) and (D)] FE model.

