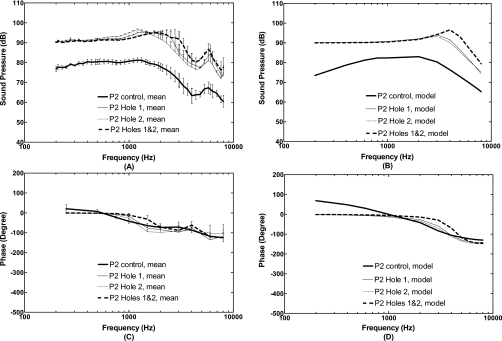
Figure 7.
Mean sound pressure level in the middle ear cavity (P2) with standard errors measured from five temporal bones and calculated from the FE model in control or intact TM (thick solid lines), perforations Hole 1 (thin solid lines), Hole 2 (thin dashed lines), and combined Holes 1 and 2 (thick broken lines). The input sound pressure P1 was 90 dB at 2 mm from the umbo in the ear canal. [(A) and (C)] Bone experiments; [(B) and (D)] FE model.

