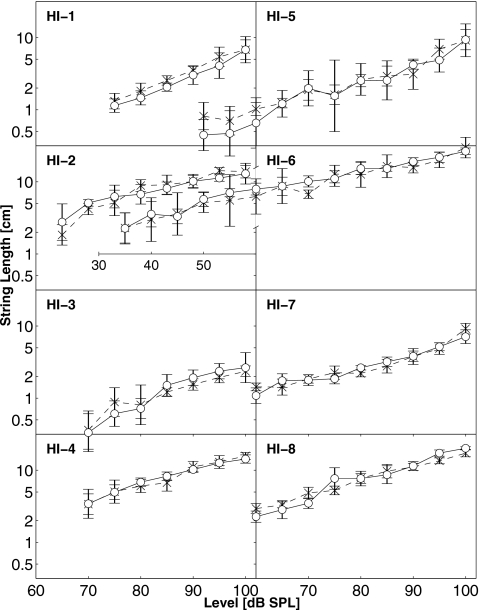
Figure 1.
Individual monaural loudness functions for tones from all eight HI listeners. The geometric means of string lengths are plotted on a log scale as a function of level. Data are shown separately for left (x) and right (o) ears. The vertical bars show ±1 standard deviation of the log of the string lengths. Note that data for listeners HI-5 and HI-6 are continued into the left panel while maintaining the same relative scale.

