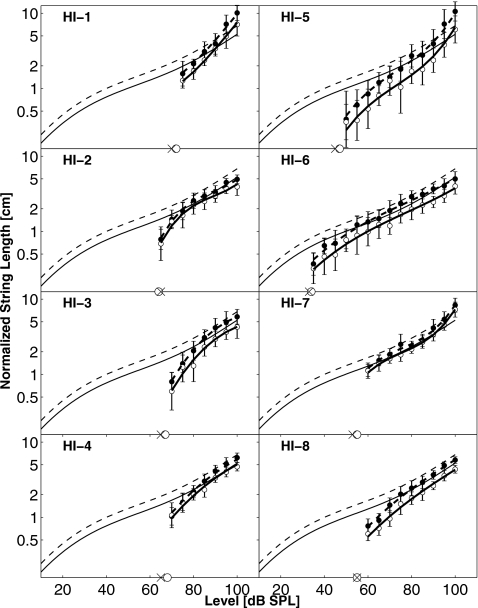
Figure 3.
Individual normalized data (see text) replotted from Fig. 2 together with polynomial fits for the binaural (thick dashed lines) and the monaural (thick continuous lines) loudness functions. The averaged normal data for eight listeners from Marozeau et al., 2006 are also shown for the corresponding binaural (thin dashed line) and monaural (thin continuous line) loudness functions for 1-kHz tones. Absolute thresholds are shown for left (x) and right (o) ears on the abscissa.

