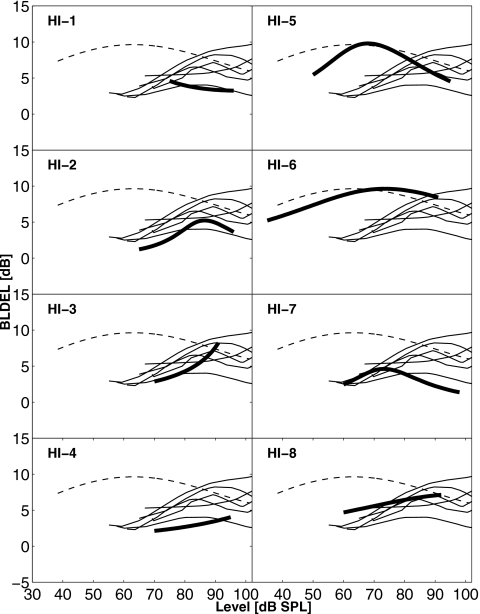
Figure 4.
The BLDEL is plotted as a function of level. The polynomial fits to individual data from the present study (thick lines) are compared with the data of Whilby et al. (2006): individual data from eight HI listeners (thin lines) and averaged data from eight normal-hearing listeners (dashed lines). Each panel represents a polynomial fit for one listener from the present study compared with all the data from Whilby et al. (2006).

