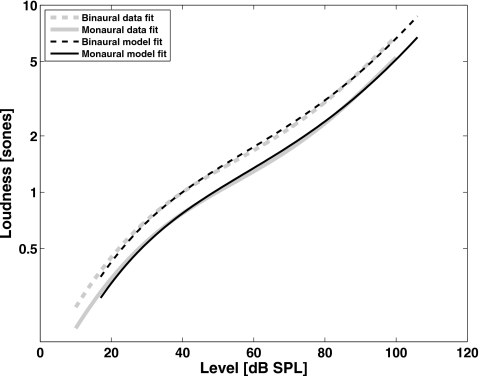
Figure 5.
Modification of the method described in Marozeau et al., 2006. The thick gray lines represent the binaural (dashed line) and average monaural (continuous) loudness functions of eight normal-hearing listeners (Marozeau et al., 2006); the thin dark lines represent the binaural (dashed line) and monaural (continuous line) loudness-growth functions constructed for individual listeners from the binaural level difference data for equal loudness (Whilby et al., 2006). The function is constructed here with a fourth-order polynomial, instead of the third order used in Whilby et al., 2006.

